Operations | Monitoring | ITSM | DevOps | Cloud

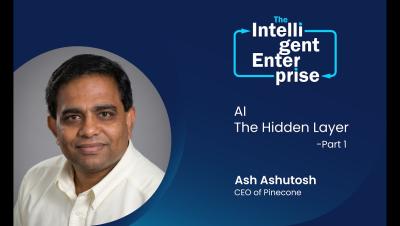
Episode 13 - AI: The Hidden Layer (Part 1)

What does enterprise AI look like when the user is no longer human? In this episode of The Intelligent Enterprise, host Tom Stoneman sits down with Ash Ashutosh, CEO of Pinecone and a three-time founder, to explore the next evolution of AI infrastructure: from vector databases built for humans using chatbots, to knowledge engines designed for AI agents that need to understand context, take action, and get work done.


Quit Switching Between Tools: Network Visibility and Security in One Place

In this session, we’ll show how the Progress WhatsUp Gold solution has evolved beyond traditional monitoring. With built-in Network Detection and Response (NDR), teams can identify suspicious behavior, detect anomalies earlier and respond faster. Combining monitoring and NDR into a single platform gives IT teams a clearer view of their environment and a faster path from detection to action by consolidating tools.

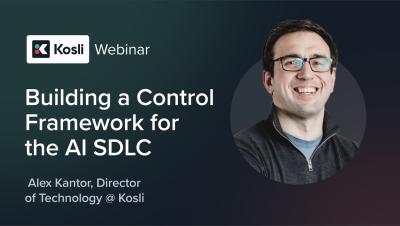
Building a Control Framework for the AI SDLC

AI coding tools are in use across regulated industries, producing workable code faster than humans can review. It’s a shift that’s raising difficult questions that haven’t been fully answered yet. What does governance look like when AI agents are writing the code, reviewing each other’s work, and fixing their own findings? How do you prove what code is running and whether it passed your checks? Who’s accountable for change approvals, audits, incidents?

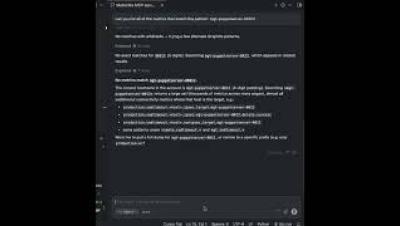
Sneak Peek: AI Powered Monitoring with MetricFire MCP Server | The Future of Observability

Get an exclusive first look at MetricFire's upcoming MCP (Model Context Protocol) Server and see how we're bringing AI-powered observability to Hosted Graphite. The MetricFire MCP Server gives AI assistants a secure way to interact with your monitoring data through purpose-built tools. Instead of manually searching dashboards and metrics, you can simply ask questions in natural language. Imagine asking.

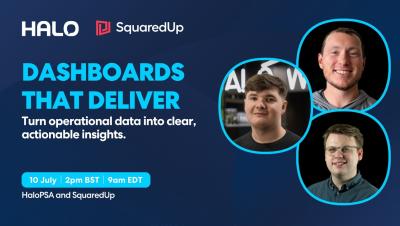
Webinar: Halo & SquaredUp - Dashboards that deliver

SquaredUp and Halo teamed up for a live webinar exploring why visibility matters, the reporting challenges many organisations face, and how HaloPSA data can be transformed into engaging dashboards using SquaredUp. We also heard from a customer on how they're using dashboards to manage costs and improve service delivery. Whether your goal is sharper reporting, greater visibility for customers, or a clearer demonstration of the value your services deliver, this session offers practical insights and real-world examples to help you get there.

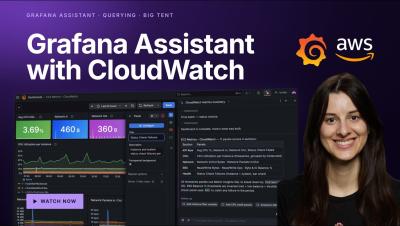
How to use Grafana Assistant with the AWS CloudWatch data source

Grafana Assistant meets AWS CloudWatch! In this video, Staff Software Engineer Ivana Huckova shows how to use Grafana Assistant, the AI agent built into Grafana Cloud, with the Amazon CloudWatch data source. Watch her query CloudWatch metrics and logs in plain language, build dashboards in seconds, and troubleshoot AWS resources — no query syntax required.