Dashboards
The Story of Grafana | Episode 3: Open (Source) for Business | Grafana Documentary
Observability for business decision making: technology challenges and approaches
How to do continuous profiling right with Grafana Pyroscope's Ryan Perry (Grafana Office Hours #26)
How to monitor a MySQL NDB cluster with Grafana
Jason Mallory is a senior MySQL/SQL server database administrator who develops monitoring and alerting solutions for operations departments in the aerospace industry. Jason is also a Grafana Champion. MySQL Network Database — or NDB, for short — is an in-memory, sharded database platform. Consisting of several moving parts, NDB can be one of the most challenging database platforms to monitor. However, monitoring NDB cluster health is crucial to ensure reliability and performance.
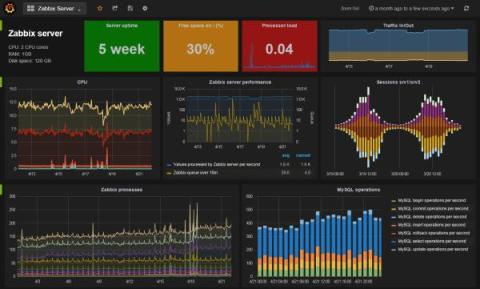
Zabbix plugin for Grafana: Grafana Labs will manage and maintain the popular plugin
I’m happy to share some exciting news! Grafana Labs is taking ownership of the Zabbix plugin, one of the most popular third-party data sources for Grafana over the years. The Zabbix plugin for Grafana allows you to visualize data from the Zabbix monitoring system, offering a quick and powerful way to create dashboards. I personally started the project in 2015, with the goal of bringing a better dashboarding experience to Zabbix users.
Incident response that's fast and cost-effective: Why these 3 companies chose Grafana Cloud
When an incident occurs, every second counts. On-call staff need to quickly get all the relevant information in front of them in a way that’s easy to digest so they can more successfully investigate the issue and communicate with relevant stakeholders.
Set up a new Grafana Cloud Account - Grafana for Beginners Ep. 5
How to set up home automation: A beginner's guide with Grafana Cloud and Home Assistant
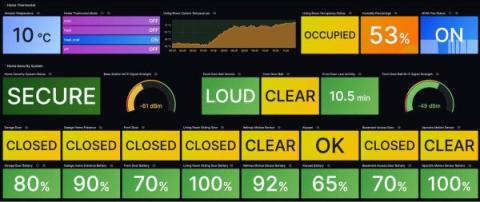
I first learned about Home Assistant when my previous job’s manager shared that he charms his wife by using home automation to have Alexa announce the weather as she starts getting ready for the day. After that, he showed us the cool Grafana dashboards where he visualizes his entire home automation setup on a screen in his basement. As fate would have it, I got a chance to work for Grafana Labs soon after that, and I started building my own home automation setup using Grafana Cloud.


