Operations | Monitoring | ITSM | DevOps | Cloud
Searching Google Drive: Better collaboration with Elastic Workplace Search
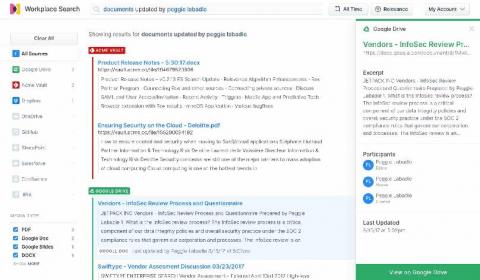
While Google G Suite is an indispensable productivity and collaboration tool for modern businesses, all too frequently content tends to pile up in the far corners of Google Drive, making content search and discovery difficult. Spending valuable time sifting and searching through tens of thousands of documents to find the right one has become all too common, and most workers spend several hours per week searching for information.
How to add powerful (Elastic)search to existing SQL applications
Elasticsearch has a lot of strengths (speed, scale, relevance), but one of its most important strengths is its flexibility to be added to existing environments without the need for any sort of architectural overhaul. If you are a sysadmin (dev, sec, ops, etc.), you know just how appealing this is. So many legacy systems remain in place not because they are perfect, but because replacing them would cost time and money that you don't have.
Identifying and monitoring key metrics for your hosts and systems
This post is the first in a three-part series on how to effectively monitor the hosts and systems in your ecosystem, and we're starting with the one you use most: your personal computer. Metrics are a key part of observability, providing insight into the usage of your systems, allowing you to optimize for efficiency and plan for growth. Let's take a look at the different metrics you should be monitoring.
Dynamic presentations with Canvas
Elastic Observability Engineer Training Preview: Structuring data
Improving search relevance with boolean queries
When you perform a search in Elasticsearch, results are ordered so that documents which are relevant to your query are ranked highly. However, results that may be considered relevant for one application may be considered less relevant for another application. Because Elasticsearch is super flexible, it can be fine-tuned to provide the most relevant search results for your specific use case(s).
How to easily correlate logs and APM traces for better observability
Application performance monitoring (APM) and logging both provide critical insight into your ecosystem. When paired together with context, they can provide vital clues on how to resolve problems with your applications. As the log data you analyze becomes more complex, navigating to the relevant pieces can be tricky using traditional tools. With Elastic Observability (powered by the Elastic Stack), correlating logs with APM is as simple as a few clicks in Kibana.
Searching Salesforce: Boosting your teams' productivity with Elastic Workplace Search
“If it’s not in Salesforce, it didn’t happen.” You’ve undoubtedly heard it, or perhaps you’ve said it yourself. And why not? Over the past 15 years, Salesforce has redefined the CRM industry, becoming the de facto solution for managing sales, customer service, marketing automation, and analytics functions with its cloud-only approach. As Salesforce’s solutions have expanded so has their user base.
Elasticsearch Service on Google Cloud Marketplace: New ways to purchase and discover
Last year we announced an expanded partnership with Google to bring Elasticsearch Service to even more Google Cloud users. We were also named one of Google Cloud's partners of the year! We've since deepened our partnership, and today we are proud to announce new ways to purchase and discover Elasticsearch Service in the Google Cloud Marketplace. You can now purchase monthly Gold and Platinum subscriptions as well as Standard, Gold, and Platinum annual subscriptions through the marketplace.
Exploring Jaeger traces with Elastic APM
Jaeger is a popular distributed tracing project hosted by the Cloud Native Computing Foundation (CNCF). In the Elastic APM 7.6.0 release we added support for ingesting Jaeger traces directly into the Elastic Stack. Elasticsearch has long been a primary storage backend for Jaeger. Due to its fast search capabilities and horizontal scalability, Elasticsearch makes an excellent choice for storing and searching trace data, along with other observability data such as logs, metrics, and uptime data.
Personalized music content search implementation
Elastic Cloud: Elasticsearch Service API is now GA
The Elastic Cloud console gives you a single place to create and manage your deployments, view billing information, and stay informed about new releases. It provides an easy and intuitive user interface (UI) for common management and administrative tasks. While a management UI is great, many organizations also want an API to automate common tasks and workflows, especially for managing their deployments.
Elastic's Guide to Data Visualization in Kibana
How to implement Prometheus long-term storage using Elasticsearch
Prometheus plays a significant role in the observability area. An increasing number of applications use Prometheus exporters to expose performance and monitoring data, which is later scraped by a Prometheus server. However, when it comes to storage, Prometheus faces some limitations in its scalability and durability since its local storage is limited by single nodes.
Building a Search Engine with Elastic App Search
Elastic Workplace Search: Unified search across all your content
Elastic Stack Alerting Overview
Elastic Stack 7.7.0 released
We are pleased to announce the general availability of version 7.7 of the Elastic Stack. Like most Elastic Stack releases, 7.7 packs quite a punch. But more than the new features, we’re most proud of the team that delivered it. A feature-packed release like this is special during normal times. But it’s extra special today given the uncertain times we are in right now.
How to enrich logs and metrics using an Elasticsearch ingest node
When ingesting data into Elasticsearch, it is often beneficial to enrich documents with additional information that can later be used for searching or viewing the data. Enrichment is the process of merging data from an authoritative source into documents as they are ingested into Elasticsearch. For example, enrichment can be done with the GeoIP Processor which processes documents that contain IP addresses and adds information about the geographical location associated with each IP address.
Elastic at home for students and educators: A resource guide
George Lucas once said, “Education is the single most important job of the human race.” When considering the requirement of education in the mastering of any role or skill, there is no debate to the truth behind his words. Education is the cornerstone on which the future is built, which is why Elastic is launching the Elastic for Students and Educators program.
APM - Diving in to the async profiler feature of the java APM agent
Live Kubernetes Debugging with the Elastic Stack
Getting started with adding a new security data source in your Elastic SIEM: Part 1
What I love about our free and open Elastic SIEM is how easy it is to add new data sources. I’ve learned how to do this firsthand, and thought it’d be helpful to share my experience getting started. Last October, I joined Elastic Security when Elastic and Endgame combined forces. Working with our awesome security community, I’ve had the opportunity to add new data sources for our users to complement our growing catalog of integrations.
Searching Confluence with Elastic Workplace Search
For many companies, Elastic included, wikis developed with Confluence are a critical source of content, procedures, policies, and plenty of other important info, spanning teams across the entire organization. But sometimes finding a particular nugget of information can be tricky, especially when you’re not exactly sure where that information was located. Was it in the wiki? In a Word doc? In Salesforce? A GitHub issue? Somewhere else?
Using Elasticsearch as a Time-Series Database in the Endpoint Agent
Elastic Observability in SRE and Incident Response
Software services are at the heart of modern business in the digital age. Just look at the apps on your smartphone. Shopping, banking, streaming, gaming, reading, messaging, ridesharing, scheduling, searching — you name it. Society runs on software services. The industry has exploded to meet demands, and people have many choices on where to spend their money and attention. Businesses must compete to attract and retain customers who can switch services with the swipe of a thumb.
Virtual Meetup: SIEM 101: What, Why & How of Information Security
Elastic's Guide to Keeping Services up and Running with Real-time Visibility
Coming in 7.7: Significantly decrease your Elasticsearch heap memory usage
As Elasticsearch users are pushing the limits of how much data they can store on an Elasticsearch node, they sometimes run out of heap memory before running out of disk space. This is a frustrating problem for these users, as fitting as much data per node as possible is often important to reduce costs. But why does Elasticsearch need heap memory to store data? Why doesn't it only need disk space?


