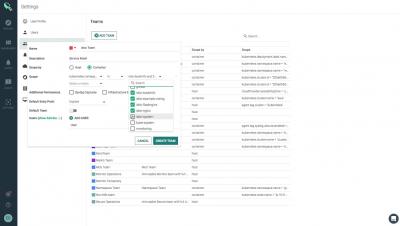
Sysdig Teams
See how to easily isolate and secure application and service data without resorting to isolated infrastructure. Provide explicit user access to containers, namespaces, services, hosts and more.


A recently disclosed vulnerability in Kubernetes dashboard (CVE-2018-18264) exposes secrets to unauthenticated users. In this blog post we’ll explore some key takeaways regarding monitoring privilege escalation on Kubernetes.
In this blog post we are going to cover how to perform Docker image scanning on Atlassian’s Bamboo CI/CD platform using Sysdig Secure. Container images with security vulnerabilities or not compliant with the security policies that you define within Sysdig Secure will be stopped, breaking the build pipeline before being pushed to your Docker registry.
At Sysdig, we have built a cloud-native intelligence platform to create a single, more effective way to monitor and secure your critical applications. We want to empower our users to quickly identify critical events and focus on events that need the most attention from you.
Today at Kubecon we announced the availability of IBM Cloud Monitoring with Sysdig. Together, IBM and Sysdig have launched this new offering to provide a fully managed enterprise-grade monitoring service for cloud-native applications on IBM Cloud. If you build, ship, and run applications on IBM Cloud, you now have direct, integrated access to Sysdig Monitor.
Over the past four years we’ve helped hundreds of organizations run reliable, secure, and compliant Kubernetes and Openshift clusters. Some of the key themes we’ve seen from organizations that have successfully grown their Kubernetes footprint are: they have immaculate labeling, understand how to leverage internal Kubernetes features to harden their platform, and understand what developers need access to and manage it with RBAC and namespaces.
Container security orchestration allows to define within your security policy how you are going to respond to your different container security incidents. These responses can be automated in what is called security playbooks. This way, you can define and orchestrate multiple workflows involving different software both for sourcing and responding. This is how Falco and Splunk Phantom can be integrated together to do this.
While you’re likely familiar with role-based access control, Sysdig teams introduce the concept of service-based access control. With service-based access control, administrators can define groups of users that have access to policy events, policy configuration, and scanning data limited to a service or set of services, as defined by your orchestration system (think Kubernetes, Mesos, and the like).