Chaos Engineering Processes
You can use chaos engineering to test processes as much as you can test how systems fail.


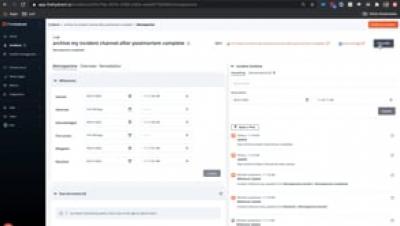
FireHydrant’s Slack integration is a great way to speed up your incident response, especially if FireHydrant Runbooks is automatically creating channels in your Slack workspace for each incident. “But what happens after the incident?” First of all, you shouldn’t have to manually archive those Slack channels; especially when you don’t want them clogging up the Slack navigation bar.
The ability to automate your incident response process means you can start responding to incidents faster. So it’s easy to see why FireHydrant Runbooks is so popular within the platform. When you let automation take over, you can spend more focus fixing problems and keeping your customers happy. Now with the addition of conditions, you can create even more powerful automation.
Our release of conditions in FireHydrant Runbooks has made it easier for teams who rely on email to communicate with key stakeholders or a distribution list. 💡If your team uses Slack, and you haven’t already installed our Slack integration, you should definitely check it out as it’s the easiest way to automate updates to channels when the status of an incident changes.
I have a beef with companies that don’t expose nearly everything their product can do with an API. I get anxious wondering, “why can I only do some of the things via the API? How is this sausage made?” Sure, there are plenty of examples of endpoints that shouldn’t be exposed, such as changing passwords probably should be kept private. Regardless, there are tons of examples of products that I can type in a field in the UI, but that field isn’t available in the API.
Almost everyone knows that working with third-party APIs can be challenging. Sometimes the errors happen unexpectedly. Sometimes the error information that you receive is inaccurate. While most people feel these pains acutely, I’d like to share how we answer these challenges at FireHydrant and how it’s helped us avoid headaches and stress.
DevOpsDays Chicago 2020 was held on September 1, online. It was the first time the conference was held virtually due to the coronavirus pandemic. I was excited to attend for a couple of reasons. First, DevOpsDays Chicago is one of the better known and respected DevOpsDays held in the US. I’d never been able to attend it before, so it was great to get the opportunity. Also, I’d been missing the DevOpsDays community.
KubeCon + CloudNativeCon Europe 2020 Virtual happened online, August 18-20. It was the first virtual KubeCon, due to the coronavirus pandemic. I was happy to attend, although this was the second straight virtual conference I’ve participated in that ran on Amsterdam time. I did make it up for the 4 AM Pacific time start, though, and I was ready to go. As I got settled in, in front of my laptop, I knew I would be missing the hallway track a lot.