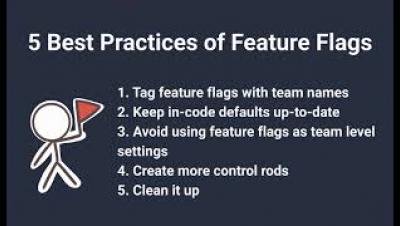
Operations | Monitoring | ITSM | DevOps | Cloud

Honeycomb

The Future of Ops Careers

Have you seen Lambda: A Serverless Musical? If not, you really have to. I love Hamilton, I love serverless, and I’m not trying to be a crank or a killjoy or police people’s language. BUT, unfortunately, the chorus chose to double-down on one of the stupidest and most dangerous tendencies the serverless movement has had from day one: misunderstanding and trash-talking operations.

New Product Updates What Does it Mean to Observe and Debug in 'Hi Res'

A number of Honeycomb features have been released throughout spring 2019 that, collectively, we like to say deliver “hi-res” across the Engineering and DevOps lifecycle. What do we mean? First, hi-res with Honeycomb means you get clearer visibility about how your production is behaving in real time, as you release new code. Secondly, it means once you have those insights (thanks to granular event data stored in Honeycomb), you can debug and resolve more efficiently. So, how do we do it?

Eaze into Observability

On-call teams use Honeycomb’s analytics to discover exactly what is happening with code in production. While incident response is a key reason engineers rely on Honeycomb, observability also delivers unique value during the development process. Eaze takes observability a step further and uses Honeycomb to prioritize what’s needed to stabilize their existing service while informing how they build their new Go and Node.js microservices platform all at the same time.

Handle Unruly Outliers with Log Scale Heatmaps

We often say that Honeycomb helps you find a needle in your haystack. But how exactly is that done? This post walks you through when and how to visualize your data with heatmaps, creating a log scale to surface data you might otherwise miss, and using BubbleUp to quickly discover the patterns behind why certain data points are different.

Honeycomb Learn Ep 1 Instrument Better for a Happy Debugging Team

Nathan LeClaire, Sales Engineer @honeycombio knows first-hand that the key to instrumenting code is to start with baby steps. With Honeycomb, a little instrumentation will give vast insights as soon as you ingest your data. With Honeycomb Beelines, we take the heavy lifting out of instrumenting. Listen to learn: See Honeycomb in action, hear best practices, and learn how fast and painless instrumentation can be.

Honeycomb Learn Ep. 2: De-stress Debugging -Triggers, Feature Flags, & Fast Query

This episode in our Honeycomb Learn series looks at how to cut stress levels when debugging issues in production. Starting with a hypothesis, run fast queries, and then navigate to the code where the problem lies. Be proactive and set triggers to let you know if something needs attention. When engineering is about to ship a new release, set a feature flag to watch how production behaves in real-time. Curtail performance issues and reduce customer impact with the right tools to better understand production systems, right now.

Honeycomb Learn Ep. 3: See The Trace? Discover Errors, Latency & More across Distributed Systems

Distributed systems bring complexity for developer and ops teams. When incidents occur in production, expected and unexpected, you want to pinpoint which part of the service is giving problems. Distributed tracing illuminates distributed systems, making your logs easier to navigate. Quickly identify where there are errors or latency in your code or service, even within 3rd party services you use. Instrumentation is the key to the best tracing experience possible.