Operations | Monitoring | ITSM | DevOps | Cloud

logz.io

Shipping Multiline Logs with Filebeat

Multiline logs provide valuable information for developers when troubleshooting issues with applications. An example of this is the stack trace. A stack trace is a sequence of method calls that an application was in the middle of when an exception was thrown. The stack trace includes the line in question that encountered the error, as well as the error itself.

Tyto Care: Accelerating Telehealth in the Fight against COVID-19

At Logz.io, our team has the opportunity to partner with many cutting edge technology companies and products from different trades. Many have a crucial mission and help save lives worldwide. In the fight against the novel coronavirus, telehealth is one such sector. It compels us to do all we can to support these organizations by improving application accessibility and performance for users who need it. One of our customers epitomizes this—Tyto Care. Tyto Care is a healthcare pioneer.

10 Indispensable Amazon EKS Features and Updates You Ought to Know

Amazon’s Elastic Kubernetes Service (EKS) is the company’s managed option for Kubernetes clusters. We have several articles on using AWS and Kubernetes on our blog, and felt there was a need to highlight some of the key features that AWS EKS offers. Many of these features have been rolled out or updated over the last year. We have mentioned some of these features in other posts, such as our comparison of EKS with AKS and GKE.

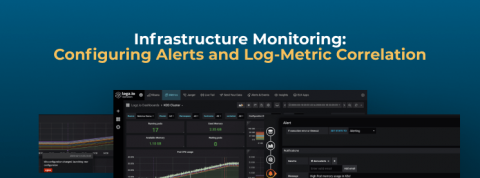
Logz.io Infrastructure Monitoring: Configuring Alerts and Log-Metric Correlation

If you’ve followed our latest blog posts, you’ll have learned how to send metric data to Logz.io and visualize that data on Infrastructure Monitoring – our Grafana-based metrics monitoring solution that we made Generally Available on Monday. At this point you’ll have some nice looking Grafana dashboards in your account.

Logz.io Infrastructure Monitoring: Building Grafana Visualizations

Yesterday, my colleague Mike Elsmore wrote a blog about sending metrics to Logz.io Infrastructure monitoring – now let’s analyze them by building Grafana visualizations! Once you’ve started to send metric data to Logz.io, how do you visualize and interpret that data so that it’s useful for you? In Logz.io Infrastructure Monitoring, we use Grafana to provide dashboards and bring meaningful information to light.

Logz.io Infrastructure Monitoring: Grafana and Kibana are Better Together

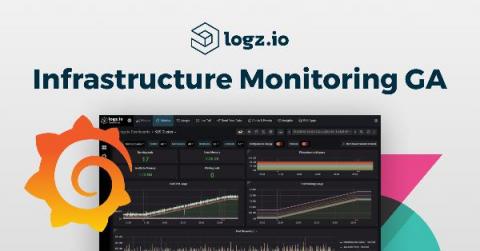
In the midst of a complex and challenging global environment, I’m proud and excited to announce General Availability for Logz.io Infrastructure Monitoring, our new metrics monitoring and analytics solution based on Grafana. Additionally, we’re supporting Early Availability for our new Distributed Tracing offering powered by Jaeger. The release represents a huge next step in our mission to provide the best open source for observability as a fully managed, cost-effective cloud service.

Logging Python Apps with the ELK Stack & Logz.io

Logging is a feature that virtually every application must have. No matter what technology you choose to build on, you need to monitor the health and operation of your applications. This gets more and more difficult as applications scale and you need to look across different files, folders, and even servers to locate the information you need. While you can use built-in features to write Python logs from the application itself, you should centralize these logs in a tool like the ELK stack.

Grafana vs. Graphite

This blog post will pit Grafana vs Graphite against each other, two of the most popular observability tools on the market today. R&D organizations typically implement a wide technology stack. They include varying services, systems, or tools to support their production and development environments. Most, if not all, of these companies have SLAs requiring R&D to provide high availability solutions and the ability to respond to incidents in real time.