Operations | Monitoring | ITSM | DevOps | Cloud
Working Locally to Enhance Your Python Collector
How to monitor DNS query response time
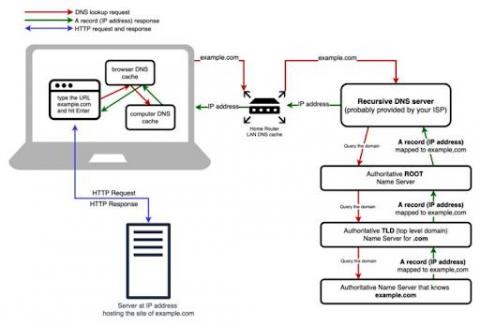
DNS (Domain Name System) servers translate standard language web addresses to their actual IP addresses for network access. DNS response time is the time it takes a Domain Name Server to receive the request for a domain name’s IP address, process it, and return the IP address to the browser or application requesting it. When it comes to DNS response times, the lower the better, and generally values less than 100ms are considered to be in the acceptable range (depending on the application).
How to monitor host reachability
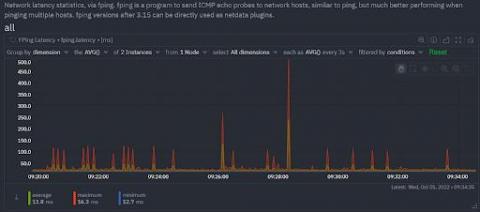
Most sysadmins and developers have at some point used a few of the popular Linux networking commands or their Windows equivalents to answer the common questions of host reachability- that is, whether a host or service is reachable and how fast it responds. One of the simplest, common checks, is to simply ping a host to verify that it’s reachable from where you issue the command, and to see the total time it takes for the host to receive your request.
Why is data replication important?
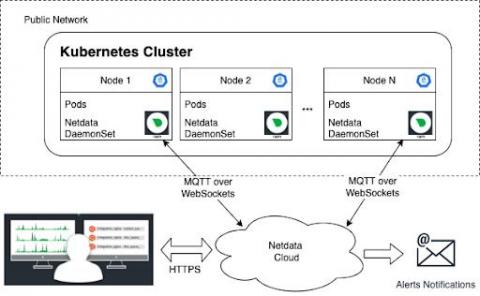
High availability. This is what every monitoring tool needs to ensure that you never compromise on IT infrastructure visibility. On top of high availability, do you really want to enable all available features on your production system? It is important for the monitoring tool to have a low footprint on your CPU consumption and memory usage. Let’s dive deeper into the recommended way of configuring Netdata to ensure high availability and a low resource footprint through data replication.
How to filter metrics by label?
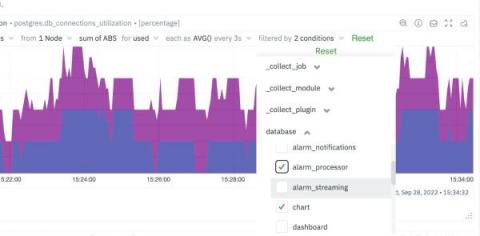
It is sometimes easy to get lost in the mountain of metrics and infinite number of dimensions when working with an infrastructure monitoring tool. Being able to filter metrics by label and visualize only what is relevant to the current scope of monitoring & troubleshooting, becomes absolutely crucial to the success of SREs, Sysadmins and DevOps professionals.
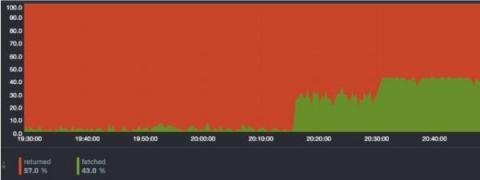
Missing indexes in PostgreSQL? How to quickly identify it
While working on improving the Netdata PostgreSQL collector, we were monitoring our production PostgreSQL instance and something caught our attention immediately. The rows fetched ratio seemed really, really low for one particular database… there were missing indexes in PostgreSQL! Rows fetched ratio is the percentage of rows that contain data needed to execute the query (rows fetched), out of the total number of rows scanned (rows returned).
Redis Monitoring
Redis is a popular open-source, in-memory data store used across industries by a variety of companies, including Github, Stack Overflow, Twitter and Netdata! Redis supports multiple use-cases including.
PostgreSQL Monitoring Upgrade
PostgreSQL Monitoring with Netdata
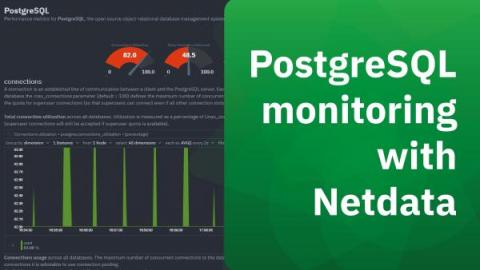
PostgreSQL is a popular open source object-relational database system designed to work for a wide range of workloads from single machines to data warehouses to web services with many concurrent users. PostgreSQL runs on all major operating systems and is used by teams and organizations across the world, including Netdata. If you are using PostgreSQL in production, it is crucial that you monitor it for potential issues. And the more comprehensive the monitoring the better!


