Introducing Anomaly Advisor - Unsupervised Anomaly Detection in Netdata
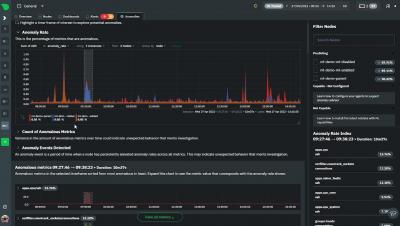
Today we are excited to launch one of our flagship ML assisted troubleshooting features in Netdata – the Anomaly Advisor. The Anomaly Advisor builds on earlier work to introduce unsupervised anomaly detection capabilities into the Netdata Agent from v1.32.0 onwards.