Operations | Monitoring | ITSM | DevOps | Cloud
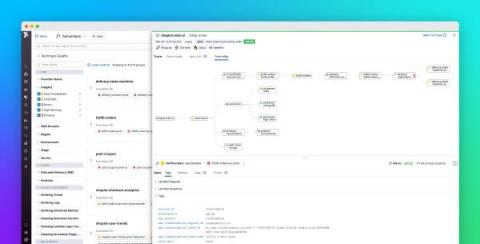
Datadog Serverless Monitoring for Amazon API Gateway, SQS, Kinesis, and more
Many organizations leverage AWS to build fully managed, event-driven applications, which break down complex workloads into APIs, event streams, and other decentralized services in order to improve performance and scalability. This type of architecture relies primarily on AWS Lambda functions to process synchronous and asynchronous requests as they move between a workload’s resources, such as Amazon API Gateway and Amazon Kinesis.
How to take action from Datadog Apps
Engineers who support production environments are tasked with resolving new issues as quickly and efficiently as possible. But as they look to carry out these responsibilities, their remediation workflows tend to take on the following pattern: For example, someone on your team might discover in a log analysis tool that a user is flooding a key service by making an abnormal number of requests.
Datadog acquires CoScreen
At Datadog, we’re dedicated to building a platform that helps teams detect, troubleshoot, and resolve issues in their applications and infrastructure. We know that our customers need to be able to debug issues, explore ideas, and manage incidents efficiently, and that means having access to tools that can help them seamlessly share information and leverage the expertise of their distributed teams.
Monitor SAP NetWeaver with Agentil's offering in the Datadog Marketplace
SAP delivers a suite of solutions for managing business operations, such as enterprise resource planning (ERP), customer relationship management (CRM), and supply chain management. Many of these solutions, including SAP S/4HANA, run on top of the SAP NetWeaver application development and integration platform. Enterprises and SAP managed providers often operate hundreds or even thousands of SAP NetWeaver systems, and Agentil provides a centralized, low-overhead way to monitor their entire fleet.
Datadog on Profiling in Production
Use Datadog's Sourcegraph extension to navigate code and visualize service dependencies
Sourcegraph is a universal code search tool that enables you to easily navigate and understand all of your code, regardless of the number of repositories you have and where they’re hosted. Its built-in code intelligence feature lets you jump to the definition and references of functions and variables, helping you learn new codebases faster.
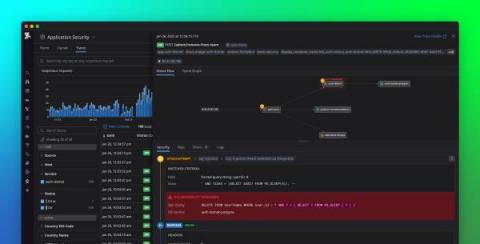
Introducing Datadog Application Security
Securing modern-day production systems is expensive and complex. Teams often need to implement extensive measures, such as secure coding practices, security testing, periodic vulnerability scans and penetration tests, and protections at the network edge. Even when organizations have the resources to deploy these solutions, they still struggle to keep pace with software teams, especially as they accelerate their release cycles and migrate to distributed systems and microservices.
Monitor mainframe performance with mainstorconcept's offering in the Datadog Marketplace
mainstorconcept’s z/IRIS software provides performance monitoring solutions for IBM mainframe z/OS systems, so you can assess your mainframes’ health and their impact on mission-critical services. With support for OpenTelemetry, z/IRIS creates integrable observability data from your mainframe systems.


