Operations | Monitoring | ITSM | DevOps | Cloud

Datadog

NodeJS Instrumentation - Creating Custom Spans for Method-Level Visibility | Datadog Tips & Tricks

In part 2 of this 4 part series, you’ll learn how to instrument your NodeJS application to capture custom method-level spans, allowing visibility into how specific methods behave in your application. Flame graphs allow for deep insight into the performance of your code. During instrumentation, we can capture custom spans for deeper layers of visibility in the resulting flame graphs. In this video, we use instrumentation to capture a method-level span, allowing us to see the performance of that specific method in our flame graphs in the Datadog UI.

NodeJS Instrumentation - Adding Analyzed Spans for Improved Data Analytics | Datadog Tips & Tricks

In part 4 of this 4 part series, you’ll learn how to add Analyzed Spans to your traces to open up even more data search and aggregation capabilities via App Analytics. In this video, we will walk you through how you can turn any span into an Analyzed Span. Analyzed Spans function like the root spans of a trace, allowing us to turn the tags embedded in them into facets for advanced data aggregation and searching in App Analytics. You can check out how to add tags to spans—and how to utilize them in App Analytics—in our first video of the series here.

Monitor AWS GovCloud (US) with Datadog

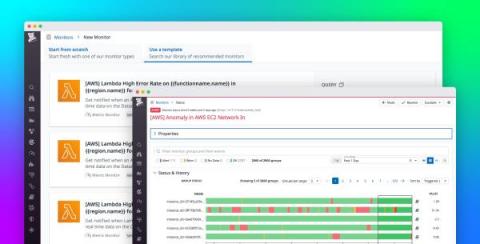
Public sector organizations face a unique challenge when it comes to the cloud: how can they successfully migrate their operations while maintaining an air-tight, heavily regulated, massively distributed environment? To solve this problem, Amazon created the AWS GovCloud (US), two isolated Regions in the AWS ecosystem that are only accessible to US customers who meet strict security and compliance standards.

Explore Kubernetes resources with Datadog Live Containers

Running Kubernetes applications requires visibility into not only the overall performance of clusters but also the health of individual pods, deployments, and other resources that make up your environment. Datadog already integrates with your containerized environments and includes features like the Live Container view and the Container Map, enabling you to easily monitor Kubernetes and container runtime performance in real time and get deep visibility into clusters.

Effortless Load Testing | Simon Aronsson (Load Impact / k6)

Load testing and performance monitoring used to be really hard and bothersome. Not any more! With modern code-first tools and visualisation, being on top of your service scalability and performance is no longer something that's reserved for the QA department. According to research by Google, 53% of mobile website visitors will leave if the page load duration exceeds three seconds. Armed with this knowledge, We'll go through how to implement load tests and performance monitoring around it as well as how to efficiently visualize it.

Analyze code performance in production with Datadog Continuous Profiler

To complement distributed tracing, runtime metrics, log analytics, Synthetic Monitoring, and Real User Monitoring, we’ve made another addition to the application developer’s toolkit to make troubleshooting performance issues even faster and simpler. Continuous Profiler is an always-on, production code profiler that enables you to analyze code-level performance across your entire environment, with minimal overhead.