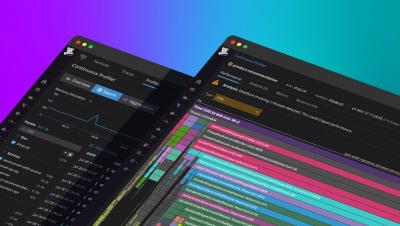
Operations | Monitoring | ITSM | DevOps | Cloud

Monitor DNS with Datadog

DNS is a critical component of your infrastructure, enabling your services to reach the endpoints they rely on and connecting your users to your web applications from anywhere in the world. In order to keep your DNS healthy and performant, you need complete visibility into both internal and external DNS resolution. Datadog is excited to announce new DNS monitoring features that help you troubleshoot DNS end-to-end, so you can ensure your applications’ performance and availability.

Generate process metrics to analyze historical trends in resource consumption

Your application’s health depends on the performance of its underlying infrastructure. Unexpectedly heavy processes can deprive your services of the resources they need to run reliably and efficiently, and prevent other workloads from executing. If one of your applications is triggering a high CPU or RSS memory utilization alert, the issue has likely occurred before.

Monitor Snowflake with Datadog

Snowflake is a cloud-native data platform that enables users to easily store, manage, analyze, and share high volumes of structured and semi-structured data. Whereas traditional data architectures often consist of multiple databases, data warehouses, and data lakes, Snowflake breaks down the silos between your different data sources and serves as a single source of truth for a wide range of simultaneous workloads.

Expand your Sleuth monitoring reach with Datadog

Sleuth is a deployment tracking tool that gives you a deeper level of insight into your CI/CD workflows by tracking all of your team’s deployment tools from a single dashboard. Sleuth integrates with different components of your deployment pipeline and develops an understanding of your development processes. It can then automatically alert you as to when code is shipping, when manual approvals are needed, and when failures occur.

Monitor serverless configuration changes with Datadog Deployment Tracking

Serverless architectures remove the need to provision and maintain infrastructure components like servers and containers, so developers can focus on writing and deploying code. However, serverless architectures also introduce new challenges to monitoring and observability. Teams building serverless applications can iterate quickly and deploy frequent code and configuration changes, making it difficult to track what impact these changes have on your applications.

AWS Distro for OpenTelemetry will send metrics and traces to Datadog

Datadog has a long-standing commitment to open standards. Our integrations with OpenMetrics, JMX, and WMI, as well as our implementation of the tried-and-true StatsD protocol, enable you to collect data with the tools and libraries that fit best into your workflows.

Track open source security exposure with Snyk and Datadog

Using open source code makes it easier to build applications, but the freely available nature of open source code introduces the risk of pulling potential security vulnerabilities into your environment. Knowing whether or not customers are actually accessing the vulnerable parts of your application is key to triaging security threats without spending hours fixing an issue that doesn’t affect end users.

Tracing without Limits: live-query all traces, retain only the ones you need

Tracing is a critical part of monitoring application performance, especially as organizations shift to deploying services using distributed systems, serverless computing, and containerized environments. Teams need real-time, end-to-end visibility into all of the traces relevant to performance issues such as an application outage or an unresponsive service, but managing tracing costs often results in gaps in valuable tracing data.

Add more context to your logs with Enrichment Tables

Logs provide valuable information for troubleshooting application performance issues. But as your application scales and generates more logs, sifting through them becomes more difficult. Your logs may not provide enough context or human-readable data for understanding and resolving an issue, or you may need more information to help you interpret the IDs or error codes that application services log by default.