Operations | Monitoring | ITSM | DevOps | Cloud

Dashboards

GrafanaCon EU 2018: Using Postgres, Prometheus and Grafana for Storing, Analyzing and Visualizing Metrics

In this talk, we take a somewhat heretical stance in the monitoring world, and describe why and how we chose to use PostgreSQL as a Prometheus backend to support complex queries (and get a full SQL interface).

Visualize & Create Dashboards With Grafana In GroundWork Monitor

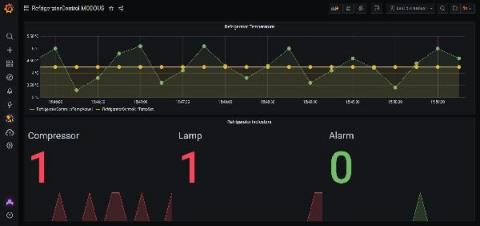
This webinar presented by GroundWork Open Source shows users how to gather and visualize data in a clear, flexible way using Grafana dashboards in GroundWork Monitor. We'll show you how to gather data from any source, including time series data. We'll also walk through how to set your own thresholds and alerts. Presented by GroundWork Open Source founder and vice-president of product strategy, Thomas Stocking.

Introducing Elastic Machine Learning Data Visualizer

Automatically Model the Complexity of the Real World. Skip defining rules, specifying thresholds, or manually building out statistical models. Our machine learning features make it easy to start identifying anomalies. Just describe the data you're interested analyzing (requests per second) and what other properties might influence it (server, IP, username), and that's it.