Operations | Monitoring | ITSM | DevOps | Cloud

Speedscale

Sponsored Post

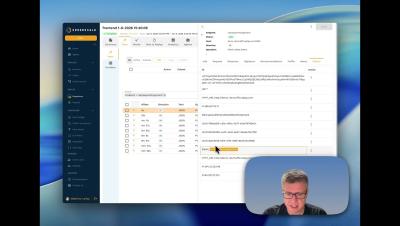
Production Data Simulation: Record in One Environment, Replay in Another

Have you ever experienced the problem where your code is broken in production, but everything runs correctly in your dev environment? This can be really challenging because you have limited information once something is in production, and you can't easily make changes and try different code. Speedscale production data simulation lets you securely capture the production application traffic, normalize the data, and replay it directly in your dev environment. There are a lot of challenges with trying to replicate the production environment in non-prod.

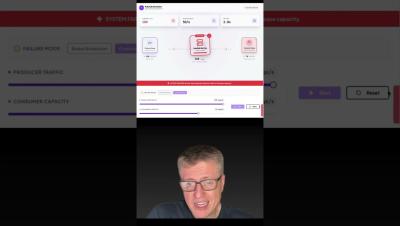
Load Testing: How Fast Can We Go?

Speedscale creates load tests from recorded traffic so generating load is pretty core to what we do. As a brief overview, we record traffic from your service in one environment and replay it in another, optionally increasing load several fold. During a replay the Speedscale load generator makes requests against the system under test (SUT), with the responses from external dependencies like APIs or a payment processor optionally mocked out for consistency. Your service is the SUT here.

Kubernetes Load Testing: Speedscale vs NeoLoad

In this article, you’ll be introduced to two tools: Speedscale and NeoLoad. Both of these tools offer you a way to load test your applications. This post will compare their ease of setup, development experience, fit within a modern infrastructure, and integration into CI/CD. Load testing is not a new concept in any way: the term was common even before Google Trends started recording data in 2004.
Sponsored Post

Top Tools to Help Debug Kubernetes Applications

When building cloud-based applications, managing the infrastructure becomes a bigger challenge as you scale. Kubernetes brings order to the chaos, letting you control and automate the containers used to deploy your application. Debugging in the cloud presents further challenges, and the complexities of distributed applications make it hard for many debugging setups to keep pace. Tools designed to run locally aren't effective. However, there are Kubernetes debugging tools that can handle the shift in paradigm. In this article, you'll read about several options that make debugging Kubernetes applications much easier.

High Scale Postman Load Testing for Kubernetes

In this Postman load testing tutorial, you’ll learn how to run a large scale load test in Kubernetes using your existing Postman collections. Because HTTP services don’t have a graphical user interface, it’s common to build collections of requests using Postman during the development process. These collections are useful for running quick functionality tests as you develop each endpoint.

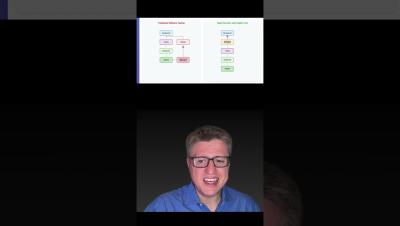
Stop Using TCP Health Checks for Kubernetes Applications

As developers, one of the most important things we can consider when designing and building applications is the ability to know if our application is running in an ideal operating condition, or said another way: the ability to know whether or not your application is healthy. This is particularly important when deploying your application to Kubernetes. Kubernetes has the concept of container probes that, when used, can help ensure the health and availability of your application.

Considerations When You Mock APIs Inside of Kubernetes

Today it’s not unusual to see organizations having implemented mocking in their daily workflow, as mock APIs allow developers to speed up their development and not rely on external services. For those reasons and others, many engineers are looking to learn more about the mocked APIs and how they can best be implemented into their organization.

Video: Cloud Native Traffic Replay

With the introduction of new application platforms like Kubernetes, oftentimes the DevOps tooling around it needs to evolve. Cloud Native technology is powerful but complex. This 5 minute demo video shows how Speedscale provides production simulation capabilities so you can check for resiliency, quality and scalability in your Kubernetes clusters. You can record data and traffic in production and replay sanitized traffic on the fly against a new cluster.
Sponsored Post

Datadog & Speedscale: Improve Kubernetes App Performance

By combining traffic replay capabilities from Speedscale with observability from Datadog, SRE Teams can deploy with confidence. It makes sense to centralize your monitoring data into as few silos as possible. With this integration, Speedscale will push the results of various traffic replay conditions into Datadog so it can be combined with the other observability data. Being able to preview application performance by simulating production conditions allows better release decisions. Moreover, a baseline to compare production metrics can provide even earlier signals on degradation and scale problems. Speedscale joined the Datadog Marketplace so customers can shift-left the discovery of performance issues.

Setting up a Multi-Architecture Kubernetes Cluster

In the last post we covered the industry shift towards ARM machines for both local and production software engineering. Last time we learned how to create Docker images that would work on multiple architectures for dev machines. Now we want to take this portability and leverage it for cost savings in production. You may be able to transition some of your services into multi-architecture builds.