Operations | Monitoring | ITSM | DevOps | Cloud

Squared Up

How to build insightful M365 Analytics Dashboards with SquaredUp and Microsoft Graph API (Part 1)

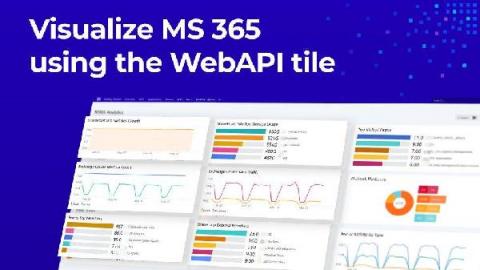
It’s incredibly helpful to be able to visualize the data produced by your organization’s M365 tenant so you can manage licenses, usage, capacity, and more. SquaredUp dashboards are ideal for this. You can use the WebAPI Tile in SquaredUp to connect to the Microsoft Graph API, which offers a broad set of functionalities for working with Azure via code. Microsoft 365 sits on top of Azure and can be managed via Graph API, too.

Getting started with Dashboard Server

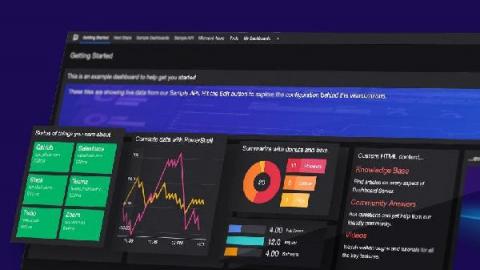
SquaredUp Dashboard Server lets you and your team create beautiful dashboards, for any tool or data, that you can share with everyone in your organization. Here’s a quick introduction to the product where we show you exactly what you can achieve, in no time at all. Let’s start with the three tabs on the top left of the screen: Getting Started, Next Steps, and Sample Dashboards. We’ll run through them one by one.

Dashboard Server Product Preview

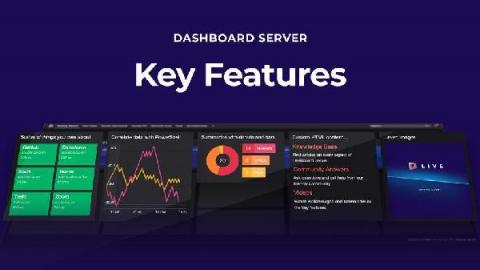
How would your IT team be transformed if you could dashboard anything, for free? Find out on 25th March at 2pm as we introduce you to SquaredUp Dashboard Server. Combining the best of SquaredUp with a powerful Powershell integration, Dashboard Server allows you to dashboard virtually any data, and is made for IT pros looking for a tool that’s quick to implement, easy to set up, and effortless to maintain.

Dashboard Server Learning Path

Hey everyone! It’s been a while since we've gone on a learning journey together, after the Azure Monitor Learning Path. I’m thankful for the love that series received, and since then, I've been looking for another opportunity to take on something new and share my learning experience with you all. Finally, the time has come!

Visualize your DevOps data for free

We recently launched the public preview of a new tool that lets anyone dashboard anything – for free. Meet Dashboard Server! You can download it free because we wanted to get our incredible dashboards in the hands of more people. The SCOM community know us well but our dashboards are perfect for so many use cases beyond System Center monitoring. And if you love them as much as we think you will, all we ask in return is that you share that love by spreading the word.

Working with the WebAPI tile - tips & tricks

Regardless of the SquaredUp product you use, the WebAPI tile is very useful when it comes to connecting to external data sources and showing them in your dashboards. It brings you closer to that single pane of glass dashboarding dream that we all have, which is why it is also one of our most used tiles!

Azure Management Talk: 8 easy steps to improve your security posture in Azure

You've deployed your application on Azure. Instantly hackers are targeting your public IP and the brute forcing of passwords and ports starts. What now? Should I deploy Azure Sentinel, or just enable Azure Security Center as a start? Join MVP and Microsoft RD Maarten Goet as he takes you through the 8 easy steps into improving your security posture on Azure. This is a demo heavy session no cloud engineer or developer should miss!