Operations | Monitoring | ITSM | DevOps | Cloud

Latest Posts

How Major League Baseball Scales Kubernetes Monitoring

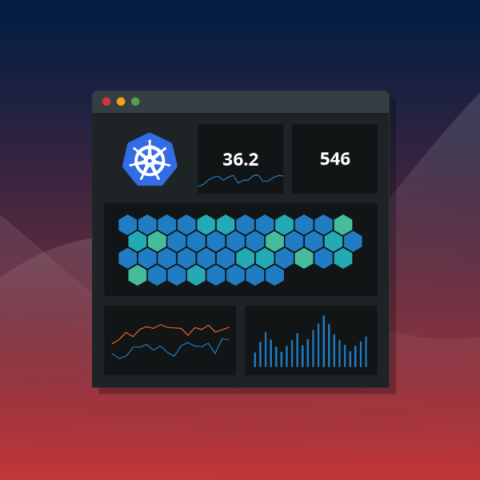
Millions of global baseball fans tuned into the World Series last week, and we at Circonus were proud to help our customer, Major League Baseball, ensure they provided those fans with seamless viewing experiences. To celebrate our partnership, we’re rolling the replay on how MLB overcame Kubernetes observability challenges with Circonus as the league quickly scaled its Kubernetes deployment.

How to Simplify Your Graphite Metric Ingestion Pipeline with Histograms

Many organizations relying on Graphite will be leveraging telemetry provided through Statsd. And if you rely on Graphite in combination with StatsD telemetry, you’re likely suffering from aggregation bloat. In a typical Graphite ingestion pipeline, applications emit data points via UDP, which are then received by an aggregator such as StatsD. Most StatsD servers only offer static aggregations, which must be configured upfront.

The Scaling Limitations of Graphite and Solutions to Overcome Them

Graphite is a free open-source software (FOSS) tool that monitors and graphs numeric time-series data. Graphite was originally a project developed internally at Orbitz in 2006, which eventually grew to be their foundational monitoring tool. In 2008, Orbitz allowed Graphite to be released under the open source Apache 2.0 license. Graphite made it possible to know more than simply if applications were up and running.

Easily Scale Your Graphite Deployment

The Graphite database has engineers feeling stuck. Perhaps you’re one of them. You find yourself collecting metrics that were defined years ago when the system was put in place, likely by someone who is no longer with the company. These pre-aggregations make it necessary to collect more data, which results in increased infrastructure and disk space costs.

Telemetry Intelligence is the Next Generation of Monitoring & Observability

As the cost of computerization and connectivity continues to plummet, the number of computers, servers, devices, and sensors continues to rapidly proliferate — and they are generating an unfathomable amount of telemetry data. Telemetry data (the metrics, events, logs, and traces being generated by applications and IT infrastructure) is growing so rapidly, it is virtually impossible to quantify.

5 Key Requirements of Modern Enterprise Monitoring & Observability Platforms

Monitoring is an essential function of enterprise SRE teams and a critical component of business service deliverability. Its importance has only grown as enterprise environments and technologies continue to evolve at a rapid pace. Unfortunately, traditional monitoring is no longer enough.

Circonus Simplifies Monitoring & Observability for Large Enterprises with Spring '22 Release

We’re excited to announce today Circonus’ Spring ’22 Release, which adds capabilities to further support the observability demands of modern-day enterprises. The Spring Release adds features across all four components of the Circonus platform – Ingestion & Alerting, Visualizations and Reporting, IronDB time series database, and the Circonus Analytics Query Language (CAQL) – with a focus on extending coverage and improving ease-of-use.

The Critical Role of the SRE & Error Budgeting

The role of SRE, Site Reliability Engineer, was first created by Benjamin Treynor in 2003 at Google after he was tasked with ensuring that their websites were available and reliable. The SRE is a multi-disciplined role that needs to have the ability to automate monitoring and observability across hundreds and thousands of complex systems.

Remove the Silos and Take a Unified Approach to Monitoring and Observability

Monitoring is no longer simply measuring whether your systems are running or are down. Rather, modern monitoring is an ongoing effort of collecting and analyzing data to identify and resolve issues quickly, prevent major disruptions, and ensure performance requirements are always met.