Operations | Monitoring | ITSM | DevOps | Cloud

Latest Posts

Video: How to Apply the Golden Signals to Your Monitoring Strategy

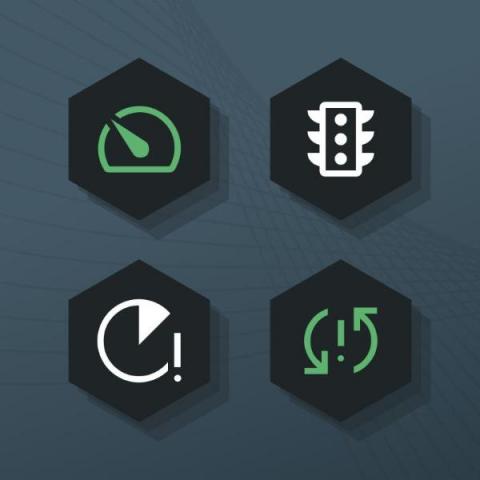
The Four Golden Signals, developed by Google SREs, are key metrics used to monitor the health of your systems. In today’s complex IT environments, these key metrics can help engineers and IT operations prioritize the most significant issues to address. The Four Golden Signals include: In the following 9-minute video, I focus on two of these signals in particular, latency and errors, because they often result in customer-facing symptoms.

Common Causes of Outages and Tips to Prevent Them

Recently, Ron DeSantis used Twitter Spaces to launch his presidential campaign. At least, he tried to. As you may have heard, the event was marred with technical difficulties, resulting in false starts, confused hosts, glitches, echoes, and the “melting” of servers. Of the more than 600,000 Twitter users who initially tuned in, less than half remained by the time they relaunched the event using a different account.

Data Shows Outage Time & Costs are Increasing - 3 Solutions You Should Consider

The Uptime Institute recently released its Annual Outage Analysis 2023 report. Overall, the report highlights the increasing costs, frequency, and duration of outages, the prominent role of cloud and digital services in outages, the shortcomings of service providers, and the need to address human error and management failures. It also underscores the ongoing challenges of handling failures in complex distributed architectures.

Correlating Metrics, Traces, & Logs-Without the Swivel Chair

Correlation in monitoring and observability refers to the process of analyzing different types of data to identify and understand relationships between application, network, and infrastructure behavior. Correlating these data sets can help IT teams identify all technology components contributing to or impacted by a performance or reliability issue, thereby empowering them to identify root cause and troubleshoot faster.

Have you Hit a Scaling Wall with Prometheus?

While Prometheus has been available since 2012, its popularity has skyrocketed in the last five years as it became the de facto solution for Kubernetes. Although Prometheus may be suitable for smaller environments, it was not designed for ultra high scale use cases or store data long-term. So as organizations are increasingly growing their Kubernetes deployments and generating substantially more data, they are reaching the limits of what they can do with standard Prometheus implementations.

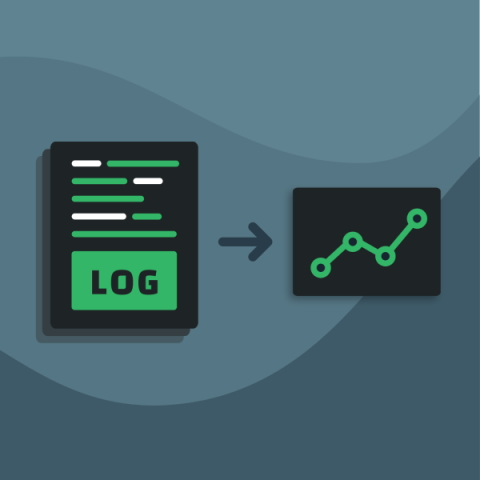
Suffering from high log costs? Too much log noise? Finally, a solution for both.

IT outage times are rapidly increasing as businesses modernize to meet the needs of remote workers, accelerate their digitalization transformations, and adopt new microservices-based architectures and platforms. Research shows that mean time to recovery (MTTR) is ramping up, and it now takes organizations an average of 11.2 hours to find and resolve an outage after it’s reported—an increase of nearly two hours since just 2020.

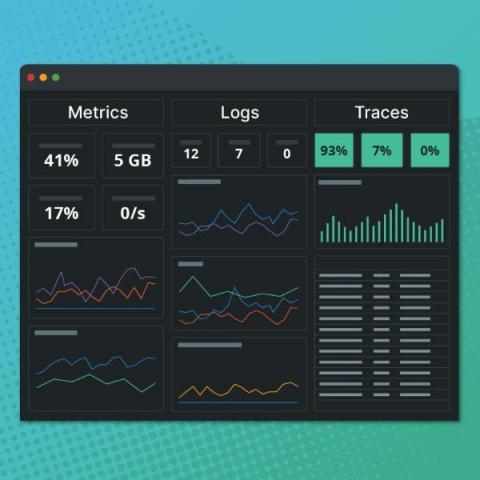
Correlate Metrics, Traces, & Logs in a Single View With Circonus Unified Dashboards

× As organizations shift to service-centric environments, they are generating substantially more data. This in turn has placed strains on monitoring and observability teams, who now must sift through an abundance of data in order to identify and resolve issues — a challenge exacerbated by the number of various monitoring tools they’ve implemented over the years.

Outgrown your ELK self-managed clusters and not sure what to do about it?

As data volume grows, managing your ELK stack can become resource-intensive. Organizations outgrowing ELK are often using multiple different tools, experiencing performance issues, paying too much in log storage, and spending significant time troubleshooting. But while the pain is real, many are hesitant to make a change. The thought of migration yields fears of lost productivity, performance and financial risks, and disappointment in losing some things you love that you worked hard to create.

Kubernetes Health-Check: The Most Critical Health Conditions To Monitor

Kubernetes can generate so many types of new metrics (millions every day) that one of the most complex aspects of monitoring your cluster’s health is filtering through these metrics to decide which ones are important to pay attention to. In fact, in a survey that Circonus conducted of Kubernetes operators, uncertainties around which metrics to collect was one of the top challenges to monitoring that operators face.

3 Challenges of Kubernetes Monitoring (With Solutions)

Kubernetes monitoring is complicated. Knowing metrics on cluster health, identifying issues, and figuring out how to remediate problems are common obstacles organizations face, making it difficult to fully realize the benefits and value of their Kubernetes deployment. Understanding how to best approach monitoring Kubernetes health and performance requires first knowing why Kubernetes observability is uniquely challenging.