Operations | Monitoring | ITSM | DevOps | Cloud

Latest Posts

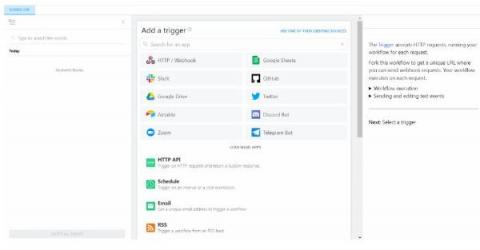
How to Create Low-Code Workflow Automations with Pipedream and InfluxDB

A big part of modern software development involves working with APIs. While using 3rd party services can speed up development, moving data around and gluing things together can be pretty dull. Luckily, there are a growing number of tools that help deal with the boring stuff so you can focus on more interesting things. One of these tools is Pipedream.

InfluxData Announces New Customers and Accelerated Momentum in Industrial Data and Internet of Things

InfluxData today announced accelerated momentum in Industrial Data and Internet of Things (IoT) driven by new customers, product enhancements and expanded industrial partnerships fueled by the growth of time series data. Customers including Tesla, Rolls Royce, Airbus, Teck, Graco and Graphite Energy are using InfluxDB to collect industrial data from devices and sensors.

Graphite Energy Uses Time Series Data to Drive Industrial Decarbonization Efforts

One major challenge with decarbonization of industrial heat is converting the variability of renewable energy into the reliability required by process plants. Solar panels only generate energy when the sun is out, and wind turbines generate energy when the wind blows. Industry, however, has a consistent and persistent need for energy. Graphite Energy, based in Australia, recognized this disconnect and set out to create a solution to it.

A Platform Gaining Momentum: Announcing New InfluxDB Features for Industrial IoT

Data – specifically time series data – continues to be the key ingredient for successful digital transformation. No matter the industry, time series data helps companies understand the activities and output of people, processes and technologies impacting their business. The effective management and use of time series data has emerged as the best path towards this goal.

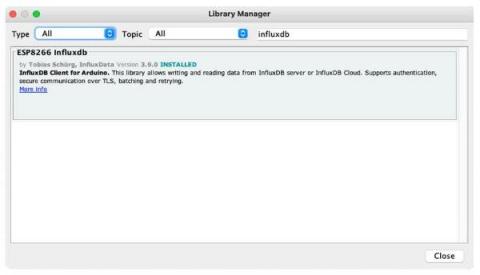
Getting Started with Arduino and InfluxDB

Time series data differs from “normal” data in an interesting way. The essential characteristic is that the data’s primary point of reference is a timestamp showing at which point in time a sample of data was measured. Time series databases like InfluxDB are helpful for situations that involve this kind of data.

InfluxData Named a Winner in 2021-22 Cloud Awards

InfluxDB Cloud wins Best Use of the Cloud in the Internet of Things category SAN FRANCISCO, February 8, 2022 – InfluxData, creator of the leading time series platform InfluxDB, today announced InfluxDB Cloud was named a winner in the 2021-22 Cloud Awards category for Best Use of the Cloud in the Internet of Things. Now in its 10th year, the Cloud Awards recognize innovation and excellence in cloud computing among startups and global enterprises.

Getting Started with the InfluxDB API

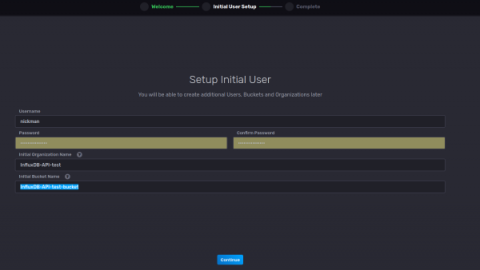
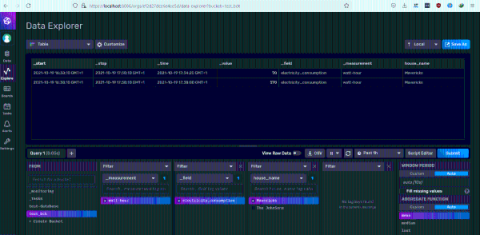
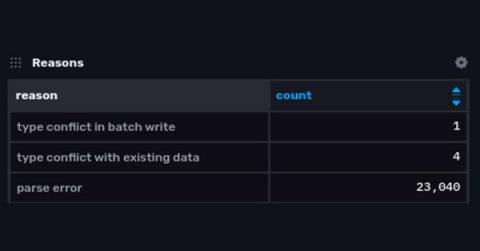
This article was written by Nicolas Bohorquez. Scroll below for the author’s picture and bio. Time series databases, like InfluxDB, index data by time. They are very efficient at recording constant streams of data, like server metrics, application monitoring data, sensor reports, and any data containing a timestamp. Data in a time series database is always written with the most recent data values but with the previous values not updated.

Getting Started with Dart and InfluxDB

You just launched your application and it’s attracted more users than you were expecting. Your web server is bombarded with data. Now you need to know more about your users: what is the dominant device they’re using, and how long are they staying on the app? A time series database will help you answer these questions. It allows you to save data for a given point over a specified period of time, which gives you insight into what type of usage you’re getting and when.

Data Visualizations with InfluxDB: Integrating plotly.js

One of the great features of the InfluxData cloud platform is that it comes out of the box with all the tools you need to quickly read and write your data to the database. Here, we’ll walk through creating data visualizations with InfluxDB and plotly.js, a JavaScript graphing library built on top of d3.js and stack.gl.