Operations | Monitoring | ITSM | DevOps | Cloud

Latest Posts

Centralize the truth of your infrastructure with alarm notifications

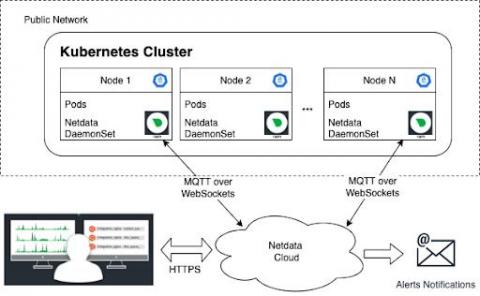
Netdata is architected on every level, across both the open-source Netdata Agent and Netdata Cloud, to help you own every layer of your monitoring experience. With this design, all metrics data collected by the Netdata Agent stays distributed on your node, but you also leverage Netdata Cloud’s dashboards and multi-node visualizations to view the health and performance of an entire infrastructure from a single application.

Netdata and StackPulse: Per-second metrics meet automated remediation

Teams of all types use Netdata to monitor the health of their nodes with preconfigured alarms and real-time interactive visualizations, and when incidents happen, they troubleshoot issues with thousands of per-second metrics on Netdata Cloud. But based on the complexity of the team and the infrastructure they monitor, some parts of their incident management, such as pre-planned communication and escalation processes, or even automated remediation, need to happen outside of the Netdata ecosystem.

Community update: Discourse, community efforts

Open source and community have always been in the DNA of Netdata, with the Agent starting as a very popular open-source project. Since then, a lot has changed, with Netdata maturing into a company, and the Netdata Agent finding its place as an open-source project in a wider offering that redesigns the monitoring experience from the ground up.

How Netdata gets you from 0 to monitoring in minutes

Netdata is zero-configuration monitoring. It’s a principle that we’ve stood behind since the project’s beginning, when it was only our CEO Costa trying to solve a “painful, real-world problem,” and it’s one we stand by today. Our insistence on zero-configuration guides every product decision we make, every grooming process, and every React component our frontend teams design.

Welcome to Netdata's community repository: Consul, Ansible, ML

On our journey to democratize monitoring, we are proud to have open source at the core of both our products and our company values. What started as a project out of frustration for lack of existing alternatives (see anger-driven development), quickly became one of the most starred open-source projects on all of GitHub.

Netdata's dashboard: open by default and secure by design

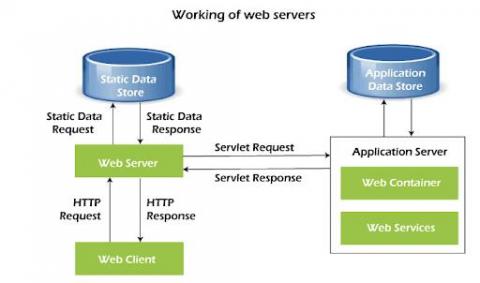
Let’s talk through a scenario: You have a Linux-based VM running on DigitalOcean (aka a Droplet), and you install Netdata on it using our recommended kickstart script. As the installation process winds down, the Droplet starts up the Netdata Agent’s web server and serves the local Agent web dashboard on port 19999.

Bringing rich and real-time infrastructure monitoring to Netdata Cloud

The Netdata Agent is well-equipped to solve monitoring and troubleshooting challenges for single nodes. We love that the Agent is so valuable to our users, but Netdata Cloud is designed for infrastructure monitoring. That’s why we’re working so hard to offer even more capabilities and help users monitor and troubleshoot infrastructures of all sizes, entirely for free!

The reality of Netdata's long-term metrics storage database

The perception that Netdata is only capable of short-term metrics storage is a myth. It’s a pervasive myth we still see in blog posts and through community engagement, despite it being false for more than a year. However, like all myths, this one on metrics storage began with a kernel of truth. When Netdata first flourished as an open-source project in 2017 and 2018, the default metrics database was RAM-only.