Monitor indoor air quality with Airthings and Netdata
Monitoring indoor air quality with Airthings and Netdata. Understanding and measuring common contaminants and pollutants reduces your risk of air quality health concerns.
Monitoring KSM (Kernel Same-page Merging) performance at deduping memory shared across VMs.
Netdata’s Cassandra collector documentation explains how to set it up to collect metrics automatically. Once you have followed the instructions in the docs and have installed and configured Netdata on the Cassandra cluster you are ready to start monitoring and troubleshooting.
Database bloat is disk space that was used by a table or index and is available for reuse by the database but has not been reclaimed. Bloat is created when deleting or updating tables and indexes. Here's how to deal with it!
What are the important Cassandra metrics to monitor and how to monitor them.
We often hear the term load used to describe the state of a server or a device, but we're here to tell you what it means, precisely, and how to monitor it.
The most important part of disk usage monitoring is to check the utilization of each filesystem and each mount point which can reveal existing or impending issues with the storage space on your infrastructure.
The life of a sysadmin or SRE is often difficult, but occasionally very simple things can make a huge difference. Basic monitoring of your systemd services is one of those simple things, which we sometimes overlook. The simplest question one would want to know is if the thing that’s supposed to be running is actually running at all. If you use systemd services, you can guarantee an answer to that question within minutes using Netdata.
Redis is designed to be fast. In most cases, it is. However, there are times when Redis may be slow, due to network issues, disk latency, or other factors. When this happens, it is important to be able to detect the slow down and investigate the cause. Latency is the maximum delay between the time a client issues a command and the time the reply to the command is received by the client. Redis has strict requirements on average and worst case latency.
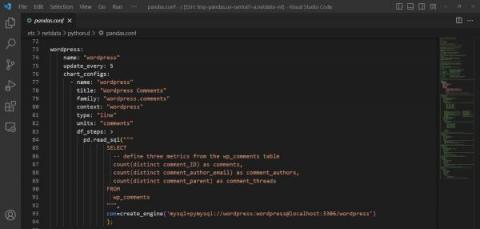
Netdata just launched a Pandas collector. Pandas is a de-facto standard in reading and processing most types of structured data in Python so if you have some csv/json/xml data, either locally or via some HTTP endpoint, containing metrics you’d like to monitor, chances are you can now easily do this by leveraging the Pandas collector without having to develop your own custom collector as you might have in the past.