There is a strong push for adopting Kubernetes’ base Agentic Framework, given the adoption for containers and the similarities between containers and agents ( agents are stateful though).
If you provide services such as live streaming, social media networking, and analytics, you need a robust platform to speed up your read/write operations per second. Caching reduces latency by storing frequently accessed objects in faster memory (RAM or in-memory data stores instead of slower disk-based storage). Amazon ElastiCache is a managed, in-memory data store and caching service in one.
This quote resonates deeply when considering the pendulum swings in technology. We’ve seen boom-and-bust cycles with various trends, from blockchain to AI. Some trends have more staying power than others, but the pendulum swings one way, only to swing back—sometimes with a vengeance, correcting the overreach of the previous swing. One of the most significant pendulum swings of the last few decades was the shift to cloud computing.
System outages cost businesses an average of $5,600 per minute, according to Gartner. That's over $300,000 per hour of downtime. But beyond the financial impact, downtime destroys customer trust, damages your reputation, and creates a backlog of urgent work for your already busy technical teams. The key to minimizing downtime? A robust DevOps alert management system that notifies you of issues before they become full-blown disasters.
Healthcare organizations are increasingly leading the charge in technology adoption, rapidly deploying advanced applications and digital tools to improve patient outcomes and operational efficiency. However, this acceleration is placing unprecedented pressure on existing IT infrastructure. Teams are being asked to support next-generation workloads, such as AI-powered diagnostics and real-time data platforms, on legacy systems, often without the benefit of increased budget or headcount.
Atlassian is retiring Opsgenie, and if you're one of the teams relying on it to manage on-call and incidents, you're facing a tough question: Do you make the forced migration to Jira Service Management or Compass, scramble for a lookalike tool — or use this moment to upgrade your entire approach to incident response? If you’re facing that decision, we get it. Changing tools midstream isn’t ideal (to say the least). But it’s also a rare opportunity to take a meaningful step forward.
In today’s evolving cloud-native landscape, having a reliable monitoring and observability setup is essential for maintaining application health and performance. Two widely used solutions, Amazon CloudWatch and the ELK Stack (Elasticsearch, Logstash, and Kibana) offer powerful capabilities for log management, metrics, and alerting. But each serves different needs and environments.
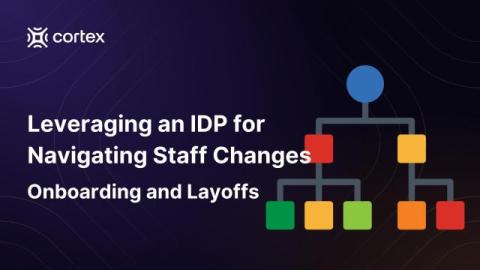
Change is constant in engineering organizations. Whether you’re growing quickly and onboarding dozens of engineers—or navigating the difficult process of layoffs—your systems, services, and institutional knowledge don’t pause. That’s where an Internal Developer Portal (IDP) becomes indispensable.
Monitoring and observability are cornerstones of modern infrastructure management. Three popular solutions that often come up in this space are the ELK Stack, Grafana, and Prometheus. This comparison breaks down the key differences, use cases, and integration capabilities to help you determine which tool or combination better suits your operational needs.
If you're working in infrastructure or operations and looking to build reliable APIs, FastAPI might be the Python framework you need. This guide will help you understand how FastAPI can fit into your automation workflows and get you started with practical examples.