Operations | Monitoring | ITSM | DevOps | Cloud

October 2024

Grafana dashboards are now powered by Scenes: big changes, same UI

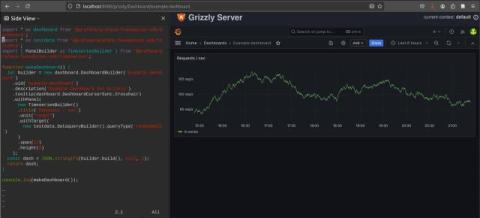
Though you might not immediately notice it the next time you log in, Grafana’s frontend has undergone a major upgrade. We recently migrated our dashboard architecture to utilize the Grafana Scenes library, enabling the creation of more stable, dynamic, and flexible Scenes-powered dashboards. Yes, the UI is pretty much the same, but under the hood, the engine responsible for visualizing the dashboards used by millions of people around the world has largely been rewritten.

Beginners guide - Visualizing Canvas in Grafana | Grafana Labs

In this video, Grafana Developer Advocate Leandro Melendez describes how Canvas panels combine the power of Grafana with the flexibility of custom elements. They are extensible visualizations that allow you to add and arrange elements wherever you want within unstructured static and dynamic layouts. This lets you design custom visualizations and overlay data in ways that aren’t possible with standard Grafana visualizations, all within the Grafana UI.

Grafana variables: what they are and how they create dynamic dashboards

A common pattern when building Grafana dashboards is to represent data for many items at once, such as simultaneously monitoring hundreds of servers. But what if there’s a problem with one of those servers? You’d want the ability to quickly identify that single server, and drill into the details without noise from all the other systems. In Grafana, dashboard variables are a great way to filter data and focus on the information that’s most important to you.

Edit your Git-based Grafana dashboards locally

Grafana has grown to become one of the most prominent dashboarding tools available, with an extensive set of features that support organizations of all sizes. There can come a time, however, when you have too many dashboards. As a software engineer, you might think, “Why can’t I do with dashboards what I do with my code?” That is, you know how to keep your code in version control (e.g., Git). You know how to share and review your code with colleagues (e.g., pull requests).

Visualize GitHub repos, projects, and more: get started with the GitHub data source for Grafana

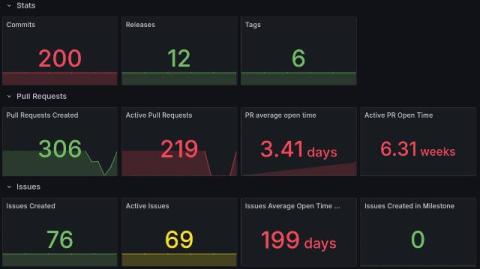
In 2020, we introduced the GitHub data source plugin for Grafana, helping organizations visualize and gain deeper insights into their use of the popular version control and collaboration platform. Since then, thousands of users have installed the data source, and we’ve been working hard to extend its capabilities and make it even easier to use.

Learn the Anatomy of a Grafana Plugin | Grafana Plugin Development

Learn about the anatomy of a Grafana plugin in this video where we'll dive deep into the various frontend and backend components involved when creating your own plugin. We'll look at the individual components for each plugin type, as well as explain how the plugin project files are organised, so that you're fully equipped to make your own awesome plugins.

Browser testing in Grafana Cloud k6: how to optimize frontend web performance

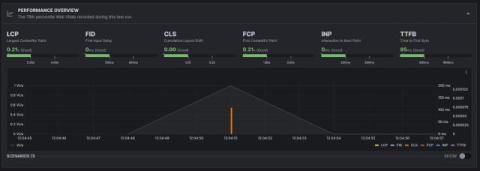
Modern websites typically have a backend API and a frontend user interface. Testing both is essential to deliver a reliable user experience and optimize engagement. Historically, Grafana Cloud k6 has helped you check one of these boxes, allowing you to test your website’s backend APIs with protocol tests. Now, we are excited to share that you can also validate your website’s frontend performance with the new browser testing feature in Grafana Cloud k6.

Grafana 11.3 release: Scenes-powered dashboards, visualization and panel updates, and more

Roll out the red carpet! Grafana 11.3 is here and marks the general availability of Scenes-powered dashboards, which set the foundation for what we envision the future of Grafana dashboards will be. But the current state of Grafana dashboards looks pretty awesome as well. The dashboard experience has improved, including the ability to trigger API calls from any canvas element with the new Actions option across many visualizations.

Set Up Links Between Data Sources With the New Correlations Feature | Demo | Grafana 11.3

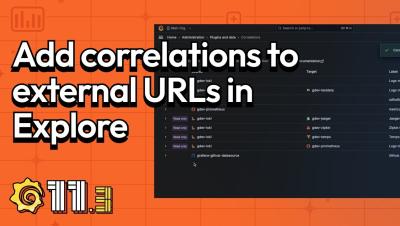
Correlations is a feature that allows Grafana users to set up links between their data sources. Previously, the link generated would only be from one query to another—meaning results from a query could only generate links to open a second Explore pane with other query results. With this feature, users can now link to third party web-based software based on their search results. The format follows the standard Grafana format for using variables. This is generally available in all editions of Grafana.

Query Language Not Required! Explore Apps Suite Demo (Logs, Metrics, Traces, Profiles) | Grafana

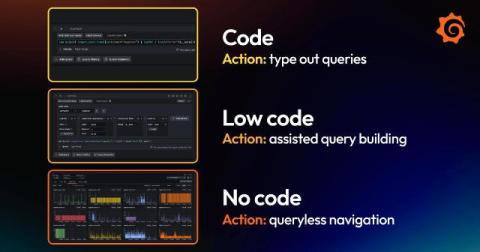
This talk dives into making observability more accessible with Grafana’s Explore apps suite. This new experience, which includes eliminates the need to write queries as you visualize and explore your data. Explore Metrics and Explore Logs (both GA), simplify navigating Prometheus and Loki data with an intuitive UI, eliminating the need to write queries in PromQL or LogQL. They come with improvements like better related metrics recommendations, OpenTelemetry logging support, and enhanced pattern detection.

Grafana 11.3 Now GA! Here's the TL;DR | Grafana

Welcome to Grafana 11.3! Scenes-powered dashboards are now generally available and the Explore Logs plugin is now installed by default. The dashboard experience has also improved in other ways including the ability to trigger API calls from any canvas element with the new Actions option and an update to transformations so you can apply calculations to dynamic fields. We’ve also simplified the alert setup experience, added customizable announcement banners that admins can send to all users, and improved some default permissions.

Monitor your generative AI app with the AI Observability solution in Grafana Cloud

Generative AI has emerged as a powerful force for synthesizing new content—text, images, even music—with astounding proficiency. However, monitoring, optimizing, and maintaining the health of these complex AI systems is challenging, and traditional observability tools are struggling to keep pace. At Grafana Labs, we believe that every data point tells a story, and every story needs a capable narrator.

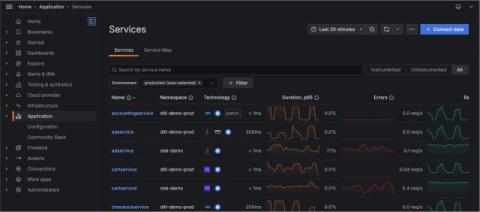
How to quickly configure Grafana Cloud Application Observability with Open Telemetry Operator

Monitoring application health is a lot like monitoring your personal health. Vital signs such as heart rate, blood pressure, and overall well-being can spot problems before they escalate, helping us maintain good health. Similarly, application health requires constant monitoring of performance indicators like CPU usage, memory consumption, and application response times.

How to Configure the OpenTelemetry Operator With Your Kubernetes Cluster | Tutorial | Grafana

In this video, Grafana Labs Staff Solutions Engineer Lionel Marks describes how to configure the OpenTelemetry Operator along with your Kubernetes cluster to automatically inject, configure, and package auto-instrumentation components that you can then monitor in Grafana Cloud Application Observability.

Grafana Cloud updates: k6 browser checks in Synthetic Monitoring, an easier way to share dashboards, and more

We consistently roll out helpful updates and fun features in Grafana Cloud, our fully managed observability platform powered by the open source Grafana LGTM Stack (Loki for logs, Grafana for visualization, Tempo for traces, and Mimir for metrics). In case you missed it, here’s a roundup of the latest and greatest updates for Grafana Cloud this month. You can also read about all the features we add to Grafana Cloud in our What’s New in Grafana Cloud documentation.

Visualize Atlassian Statuspage, Cloudflare, and Netlify data: what's new in Grafana Enterprise data source plugins

As part of our big tent philosophy here at Grafana Labs, we believe you should be able to access and derive meaningful insights from your data, regardless of where that data lives. One of the ways we stay true to that philosophy is through our Enterprise data sources.

Key Prometheus concepts every Grafana user should know

Prometheus has become an essential technology in the world of monitoring and observability. I’ve been aware of its importance for some time, but as a performance engineer, my experience with Prometheus had been limited to using it to store some metrics and visualize them in Grafana. Being a Grafanista, I felt I should dig deeper into Prometheus, knowing it had much more to offer than just being a place to throw performance test results.

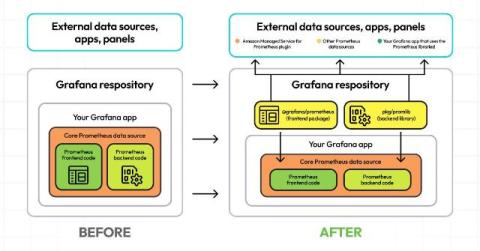
Grafana's Prometheus libraries: How we built libraries to create a truly vendor-neutral data source

Over the summer we told you about an update to our core Prometheus data source, which was part of a larger shift in our effort to meet users where they are. It’s a change we’re really excited about, as it represents our biggest step yet toward enabling the creation of truly vendor-neutral data sources for Grafana.

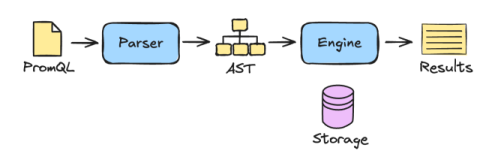
Inside PromQL: A closer look at the mechanics of a Prometheus query

Even though I’m a Prometheus maintainer and work inside the Prometheus code, I found many of the details of PromQL, the Prometheus query language, obscure. Many times I would look something up, or go deep into the code to find out exactly what it did, only to forget it again the next month. So, trying to live up to my job title of Distinguished Engineer at Grafana Labs, I resolved to write the definitive guide: what really happens when I execute a PromQL query?

Grafana for beginners: Quick tips to add a data source, choose a visualization type, and more

In the observability space, ease-of-use has always been a key differentiator for Grafana. As much as we want to offer a powerful observability platform to our users, we also want to ensure they can get up and running as quickly as possible. Still, for those of you sitting down to build your first dashboard, we totally understand that a little guidance can go a long way.

All about Explore Logs for Grafana Loki (Loki Community Call October 2024)

In this Community Call, Senior Software Engineer Trevor Whitney talks to us all about Explore Logs for Grafana Loki, an open-source app for visualizing logs from Loki in Grafana without needing to learn and write LogQL queries. He is joined by Senior Developer Advocates Nicole van der Hoeven and Jay Clifford. Community Calls are monthly meetings that are open to everyone interested in the development of Loki. They are an opportunity for software engineers working on Loki to discuss new features as well as for open-source users of Loki to ask questions.

How to use Prometheus to efficiently detect anomalies at scale

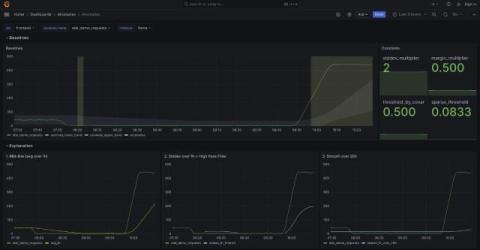
When you investigate an incident, context is everything. Let’s say you’re working on-call and get pinged in the middle of the night. You open the alert and it sends you to a dashboard where you recognize a latency pattern. But is the spike normal for that time of day? Is it even relevant? Next thing you know, you’re expanding the time window and checking other related metrics as you try to figure out what’s going on. It’s not to say you won’t find the answers.

Container monitoring with Grafana: Helpful resources to get started

In simple terms, containers are a standard package of software that enable applications to run consistently across different computing environments. Often, these applications are broken down into smaller collections of independent services known as microservices. For many organizations, these microservices-based applications have replaced traditional monolithic applications because they offer increased performance, flexibility, and scale.