Operations | Monitoring | ITSM | DevOps | Cloud

January 2023

A beginner's guide to Kubernetes application monitoring

Application performance monitoring (APM) involves a mix of tools and practices to track specific performance metrics. Engineers use APM to monitor and maintain the health of their applications and ensure a better user experience. This is crucial to high quality architecture, development, and operations, but it can be difficult to achieve in Kubernetes since the container orchestration system doesn’t provide an easy way to monitor application data like it does for other cluster components.

Distributed tracing in Kubernetes apps: What you need to know

Kubernetes makes it easier for businesses to automate software deployment and manage applications in the cloud at scale. However, if you’ve ever deployed a cloud native app, you know how difficult it can be to keep it healthy and predictable. DevOps teams and SREs often use distributed tracing to get the insights they need to learn about application health and performance.

Monitoring Kubernetes layers: Key metrics to know

Kubernetes monitoring can be difficult and complex. In order to determine the health of your project at every level, from the application to the operating system to the infrastructure, you need to monitor metrics in all the different layers and components — services, containers, pods, deployments, nodes, and clusters.

Five eye-catching Grafana visualizations used by Energy Sciences Network to monitor network data

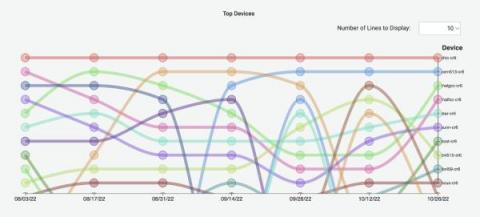
ESnet (Energy Sciences Network) is a high-performance network backbone built to support scientific research. Funded by the U.S. Department of Energy and part of Lawrence Berkeley National Laboratory, ESnet provides fast, reliable connections between national laboratories, supercomputing facilities, and scientific instruments around the globe. Our mission is to allow scientists to collaborate and perform research without worrying about distance or location.

How to use Kubernetes events for effective alerting and monitoring

Kubernetes, a graduated project of the Cloud Native Computing Foundation (CNCF) ecosystem, is the most prominent and widely used container orchestration systems. It’s used to manage and deploy containers in a wide range of environments, from IoT devices based on Raspberry Pis to enterprise environments consisting of millions of services.

How to monitor Kubernetes clusters with the Prometheus Operator

Kubernetes has become the preferred tool for DevOps engineers to deploy and manage containerized applications on one or multiple servers. These compute nodes are also known as clusters, and their performance is crucial to the success of an application. If a Kubernetes cluster isn’t performing optimally, the application’s availability and performance will suffer, leading to unhappy users and even revenue loss.

How Grafana Labs unlocks the power of recruitment data with Grafana dashboards

As the recruitment team here at Grafana Labs, we used to struggle to get a comprehensive view of our recruitment data. We had multiple sources of information, but it was difficult to pool that information so we could see the big picture and identify trends and patterns that could help us hire the right talent in a highly competitive market.

Reduce mean time to hello world with OpenTelemetry, Grafana Mimir, Grafana Tempo, and Grafana: Inside Adobe's observability stack

How is Grafana like an invisibility cloak? At Adobe, it’s one of just four tools they’re using to build observability directly into their CI/CD pipeline, making it essentially invisible — but nonetheless impactful — to thousands of developers across the organization who use it in their day-to-day lives.

Azure Managed Grafana users can now upgrade to Grafana Enterprise

In November 2021, we announced a strategic partnership with Microsoft to develop a Microsoft Azure managed service that lets customers run Grafana natively within their Azure cloud platform. Azure Managed Grafana, which became generally available in August 2022, makes it simple for Azure customers to deploy secure and scalable Grafana instances and connect to open source, cloud, and third-party data sources for visualization and analysis.

Watch: 5 tips for improving Grafana Loki query performance

Grafana Loki is designed to be cost effective and easy to operate for DevOps and SRE teams, but running queries in Loki can be confusing for those who are new to it. Loki is a horizontally scalable, highly available, multi-tenant log aggregation system inspired by Prometheus. It doesn’t index the content of the logs, but rather a set of labels for each log stream.

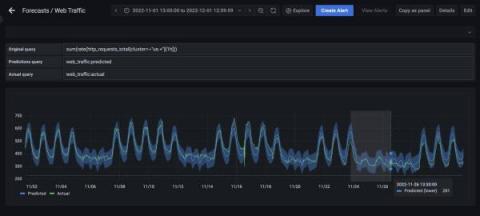
How to forecast holiday data with Grafana Machine Learning in Grafana Cloud

A little over a year ago, we released Grafana Machine Learning, enabling Grafana Cloud Pro and Advanced users to easily view forecasts of their time series. We recently enhanced Grafana Machine Learning with Outlier Detection, which allows you to monitor a group of similar things, such as load-balanced pods in Kubernetes, and get alerted when something starts behaving differently than its peers.

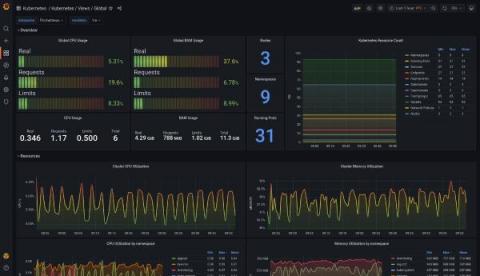
How to monitor Kubernetes with Grafana and Prometheus: Inside Powder's observability stack

David Calvert is a site reliability engineer working remotely from the south of France. He’s currently focused on observability, reliability, and security aspects of cloud infrastructure. You can find him as dotdc on GitHub and @0xDC_ on Twitter. Over the past three years, I’ve built and operated Kubernetes clusters for two different companies — the first one on-premises, and the second on a public cloud platform for my current job at Powder.

How to use the Grafana Ansible collection to manage Grafana Agent across multiple Linux hosts

Anyone who is trying to set up monitoring for multiple machines knows how tough it can get to manage multiple Grafana Agents across them. To make things easier, we recently added the Grafana Agent role to the Grafana Ansible collection, which will help users manage the Agent across multiple Linux hosts. (Need to know how to get started with the Grafana Ansible collection for Grafana Cloud?

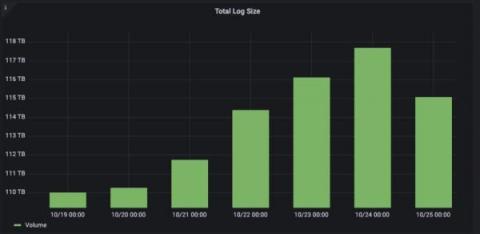
4 billion logs, 120 TB of data: How Just Eat Takeaway.com uses Grafana Cloud to scale

In 2017, Just Eat Takeaway.com (JET) was transitioning from a scrappy startup to a surging scaleup. With a global customer base and workforce, the food delivery marketplace’s front line teams needed to scale the real-time monitoring of the platform. Their initial efforts looked like “NASA’s mission control with Grafana dashboards,” said Senior Technology Manager Alex Murray.

How JPMorgan Chase uses Grafana and AI to monitor SLOs, SLIs, and more

For the team at JPMorgan Chase, the daily stakes of having a stable system are high. “We are in the business of making sure that trades are executed, and systems are stable and up and running for a positive client experience,” said Askari Imam, VP, Asset Wealth Management (Product and Integration Delivery).