Operations | Monitoring | ITSM | DevOps | Cloud

September 2020

Now you can add Amazon Timestream to your Grafana observability dashboard

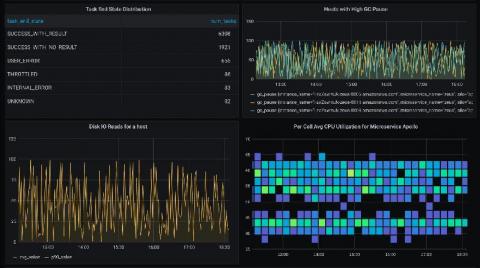
Today, AWS launched Amazon Timestream, a fast, scalable, serverless time series database purpose-built for IoT use cases. If you’re looking into trying out Timestream, know that you can visualize the native Timestream queries with Grafana out of the box. Here are some examples of the robust, SQL-style Timestream queries visualized in Grafana.

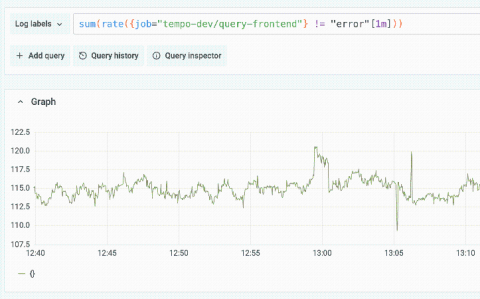
New in Grafana 7.2: $__rate_interval for Prometheus rate queries that just work

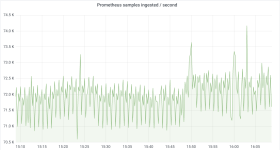
What range should I use with rate()? That’s not only the title of a true classic among the many useful Robust Perception blog posts; it’s also one of the most frequently asked questions when it comes to PromQL, the Prometheus query language. I made it the main topic of my talk at GrafanaCONline 2020, which I invite you to watch if you haven’t already. Let’s break the good news first: Grafana 7.2, released only last Wednesday, introduced a new variable called $__rate_interval.

How I'm using Grafana and Prometheus to monitor my 3D printing

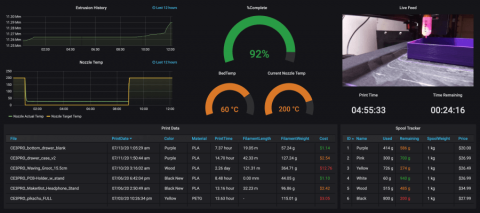
My name is Jonathan Stines, and I am a Penetration Tester for Rapid7, a cybersecurity company located in Austin, Texas. A small handful of my former colleagues at Rapid7 now work at Grafana Labs and have said it was a pretty cool spot to have landed. I had a vague understanding of what Grafana was, but what really struck my interest was when I saw their sweet dashboards in the HBO series Silicon Valley.

How we use the Grafana GitHub plugin to track outstanding pull requests

First of all, we’re pleased to announce the first release of the GitHub data source. The source code is available at github.com/grafana/github-datasource. Contributions, feature requests, and bug reports are welcome. Using the GitHub data source, Grafana users can visualize data from GitHub’s API. In this blog, we’ll go over some use cases for this handy plugin.

Introducing Grafana Metrics Enterprise, a Prometheus-as-a-service solution for enterprise scale

Today, we announced the launch of a new Grafana Labs product: Grafana Metrics Enterprise, a scalable Prometheus-compatible service designed for large organizations that is seamless to use and simple to maintain. Over the past few years, Prometheus has risen in popularity to become the de facto monitoring system for the cloud native ecosystem around Kubernetes — and for good reason.

How we're making it easier to use the Loki logging system with AWS Lambda and other short-lived services

There are so many great things that can be said about Loki – I recently wrote about them here. But today, I want to talk about something technical that has been difficult for Loki users, and how we might make it easier: using Loki for short-lived services. Historically, one of Loki’s blind spots is ingesting logs from infrastructure you don’t control, because you can’t co-locate a forwarding agent like promtail with your application logs.

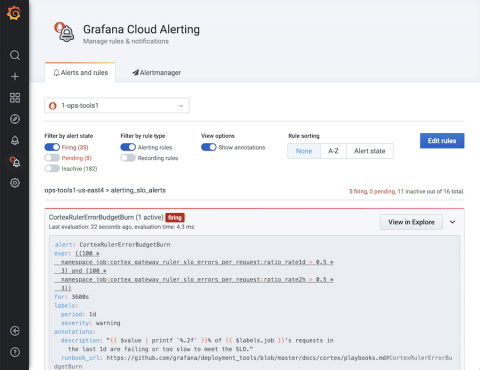
Introducing Prometheus-style alerting for Grafana Cloud

Hi! My name’s Richard Lam, and I’m the new product manager for Grafana Cloud. I’m really excited for my first contribution to this community, both so I can introduce myself to you all, and so I can highlight an awesome new Grafana Cloud feature that’s coming your way! Happy reading, and hopefully this is just the start of many more communications from me.

How Grafana Labs is reorganizing for growth

As you most likely know, Grafana Labs is growing. Growing like crazy! As Goutham Veeramachaneni noted in his blog post, “~30 people in March 2018 and now, in August 2020 we’re 180+ people. That is 6x growth in 2.5 years.” And we have no intention of slowing that growth. Matter of fact, we’re hiring as quickly as we can — and on top of that keep hiring specialists just to scale out hiring even more.

All the non-technical advantages of Loki: reduce costs, streamline operations, build better teams

Hi, I’m Owen, one of the Loki maintainers, and I’m putting proverbial pen to paper to convince you why Loki is important. And this isn’t because it scales (it does) or because I work at Grafana Labs (I do). It’s because of the oft-overlooked and underrepresented organizational benefits. Organizational benefits?! What is this, some sort of cult? Why are you avoiding the technicals? Whoa, whoa, whoa. Now, hold on. The technicals are still valid.

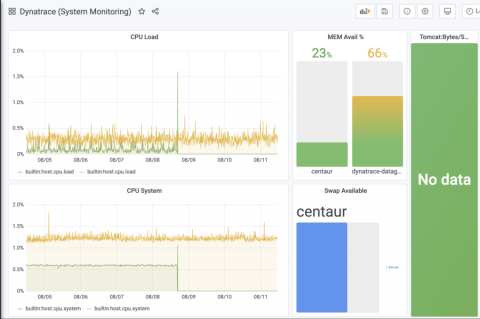
Take a peek inside the latest version of the Dynatrace Enterprise plugin for Grafana

Hi, everyone! In honor of bingeing every season of Community over the last few weeks, Eldin and Christine have been inspired to rebrand ourselves as none other than our other favorite dynamic duo, Troy and Abed! Yet, instead of singing “Troy and Abed in the morning,” we are back to write about some useful improvements we’ve made to our Enterprise Dynatrace plugin.

How we're improving backfill methods to get older data into Prometheus

A few weeks ago, I teamed up with Bartek Plotka, a principal software engineer at Red Hat, for a deep-dive session on Prometheus at KubeCon + CloudNativeCon EU. We covered a lot of topics, with highlights that included scaling Prometheus, remote-write and metadata. We ended the talk with a quick demo on how to import data from CSV files into Prometheus. I want to use this blog post to provide more insight into the state of backfill in Prometheus.

KubeCon + CloudNativeCon EU recap: What you need to know about OpenMetrics

Before Prometheus, the closest thing to a common standard for metrics was Simple Network Management Protocol (SNMP), the internet standard protocol for collecting and organizing information and monitoring networks. Front and center in SNMP is ASN1, which lacks modern design and comes with trade-offs that made sense in the past but not so much today. Aside from that, many of the existing protocols were chatty and slow as well as proprietary, very hard to implement, or both.