timeShift(GrafanaBuzz, 1w) Issue 83
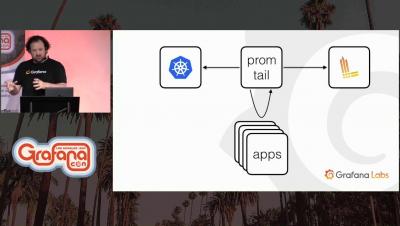
This week we have updates and articles from the Grafana Labs team, some initial impressions on our Prometheus-inspired log aggregation project Loki, and lots more. Plus learn how to make your own air quality monitor.