Operations | Monitoring | ITSM | DevOps | Cloud

August 2018

How to collect, customize, and manage Rails application logs

Logging is an important part of understanding the behavior of your applications. Your logs contain essential records of application operations including database queries, server requests, and errors. With proper logging, you always have comprehensive, context-rich insights into application usage and performance. In this post, we’ll walk through logging options for Rails applications and look at some best practices for creating informative logs.

Collecting and monitoring Rails logs with Datadog

In a previous post, we walked through how you can configure logging for Rails applications, create custom logs, and use Lograge to convert the standard Rails log output into a more digestible JSON format. In this post, we will show how you can forward these application logs to Datadog and keep track of application behavior with faceted log search and analytics, custom processing pipelines, and log-based alerting.

Auto-smooth noisy metrics to reveal trends

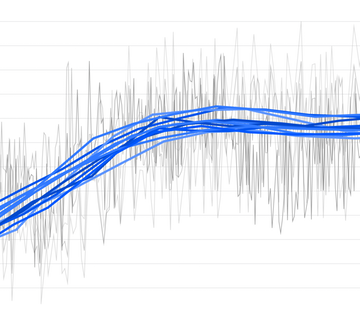
Datadog makes it easy to correlate, compare, and visualize metrics from your infrastructure and applications. Some metrics, however, are inherently so noisy that the graphs become unreadable (the dreaded spaghettification problem), and you lose the ability to extract essential information about trends and large-scale deviations. For cases like these, we provide several smoothing functions that help you identify trends in your metrics.

Introducing the Service Map in Datadog

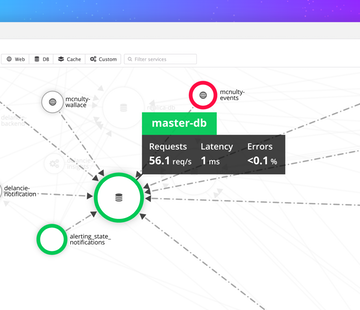
When your pager goes off at 3:00 a.m. and you need to begin your investigation, where do you start? Before you can attack the problem, you need to know the lay of the land: What else is potentially affected by this failing service? What are its dependencies? Where are the probable root causes? With the new Datadog Service Map, you can visualize the topology of your application to answer these questions and more.

Monitoring multi-cloud container storage with Portworx and Datadog

Portworx provides solutions for Kubernetes storage as well as other leading container schedulers, dramatically reducing storage, compute, and infrastructure costs for running mission-critical, multi-cloud applications with zero downtime or data loss. With Portworx, you can manage any database or stateful service on any infrastructure using any container scheduler. Portworx is trusted by many of the world’s most sophisticated IT organizations including Comcast, GE, Lufthansa Systems, the U.S.

Collecting metrics with IIS monitoring tools

In this post, we’ll show you how to use built-in IIS monitoring tools to access and graph performance counters, configure logging in IIS, and query your logs with Microsoft’s Log Parser Studio. We’ll also explain how to use a diagnostic tool to investigate memory leaks and high CPU utilization in your application pools and worker processes.

Key IIS metrics to monitor

Microsoft’s Internet Information Services (IIS) is a web server that has traditionally come bundled with Windows (e.g., versions 5.0, 6.0, and beyond). IIS has numerous extensibility features. Swappable interfaces like ISAPI and FastCGI make it possible to use IIS with a variety of backend technologies, from micro-frameworks like Flask to runtimes like Node.js, along with technologies you’d expect to find within a Windows-based production environment (e.g., ASP.NET).