Operations | Monitoring | ITSM | DevOps | Cloud

APM

The latest News and Information on Application Performance Monitoring and related technologies.

Python Instrumentation - Monitor your Python application using OpenTelemetry and SigNoz

In this video, learn how to set up application monitoring for Python apps using an open-source solution, SigNoz and OpenTelemetry. Tracing your application can give the much-needed context required to troubleshoot performance issues. OpenTelemetry is an open-source project that can help you set up an observability framework for your cloud-native applications.

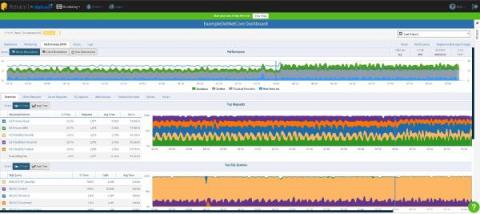
Full Lifecycle Application Performance Monitoring is a Money-Saving Hack

IT experts and techies are constantly devising new ways to do more with less in our rapidly evolving world. Traditional platforms monitoring and modern technological maintenance take a large portion of a conventional organization’s IT budget. This leaves limited resources to develop new standards-based and adaptive applications that fulfill core business demands.

Prometheus vs InfluxDB - Key Differences, concepts, and similarities

Prometheus and InfluxDB are open-source projects created to make application performance monitoring a breeze. That is, of course, if you choose the option that covers your entire observability scope. This article compares and contrasts the extent to which Prometheus and InfluxDB remedy the need for real-time insights into your applications’ operations. We’ll highlight similarities and overlaps in both usability and practicality.
Sponsored Post

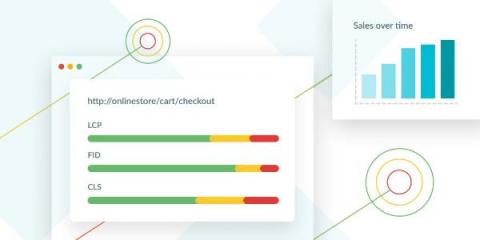
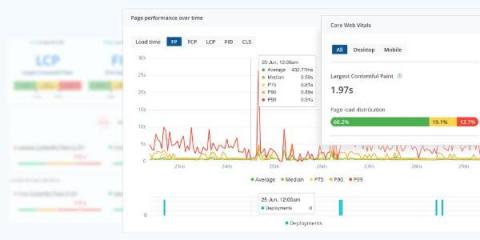
How Core Web Vitals create business impact

What are Core Web Vitals, and why should you care? Let's power through the essentials of CWV, CX and their impact on $$$. This is written with the busy software executive in mind - so we're sticking to a clear, big-picture view of metrics, user experience and revenue. Chances are, if you've heard about Core Web Vitals (CWV), it's been in the form of a stick: something Google is enforcing that can hurt your search engine visibility. We're here to go over the carrot - a quick explainer of Core Web Vitals, and how they can help you connect with customers and drive lasting innovation.

Flask OpenTelemetry - Monitoring your Flask application using OpenTelemetry

Tracing your application can give the much-needed context required to troubleshoot performance issues. OpenTelemetry is an open-source project that can help you set up an observability framework for your cloud-native applications. In this tutorial, we will use SigNoz as our backend analysis tool. SigNoz is a full-stack open-source APM tool that can store and visualize the telemetry data collected with OpenTelemetry. It is built natively on OpenTelemetry and works on the OTLP data formats.

Falcon - Monitoring apps based on Falcon Web Framework with OpenTelemetry

Tracing your application can give the much-needed context required to troubleshoot performance issues. OpenTelemetry is an open-source project that can help you set up an observability framework for your cloud-native applications. In this tutorial, we will use SigNoz as our backend analysis tool. SigNoz is a full-stack open-source APM tool that can store and visualize the telemetry data collected with OpenTelemetry. It is built natively on OpenTelemetry and works on the OTLP data formats.

Django - Monitoring Django Application performance with OpenTelemetry

Tracing your application can give the much-needed context required to troubleshoot performance issues. OpenTelemetry is an open-source project that can help you set up an observability framework for your cloud-native applications. In this tutorial, we will use SigNoz as our backend analysis tool. SigNoz is a full-stack open-source APM tool that can store and visualize the telemetry data collected with OpenTelemetry. It is built natively on OpenTelemetry and works on the OTLP data formats.

Core Web Vitals for Dev Leads

How can you quickly identify ways to improve user experience without breaking the bank or dropping your other projects? Well, according to Google, by focusing on Core Web Vitals. This is a tight but detailed 3-step guide to better UX using Core Web Vitals, for the busy technical lead or senior developer. (This is Part 2 in a series — the first covered the big-picture view for execs, with Core Web Vitals’ impact on user retention and growth.

gRPC - Monitor gRPC calls with OpenTelemetry | Explained with a Go example

OpenTelemetry can only help in generating the telemetry data. In order to store, and analyze that data, you need to choose a backend analysis tool. In this article, we will monitor collected data from gRPC calls with SigNoz. SigNoz is a full-stack open-source APM tool that provides metrics monitoring and distributed tracing. It is built to natively support OpenTelemetry data formats. Hence, it’s a great choice for a backend analysis tool to combine with OpenTelemetry. On a side note, OpenTelemetry provides you the freedom to select a backend analysis tool of your choice.