Operations | Monitoring | ITSM | DevOps | Cloud

APM

The latest News and Information on Application Performance Monitoring and related technologies.

OpenTelemetry vs. OpenTracing - Decoding the Future of Telemetry Data

OpenTelemetry and OpenTracing are open-source projects used to instrument application code for generating telemetry data. While OpenTelemetry can help you generate logs, metrics, and traces, OpenTracing focuses on generating traces for distributed applications. If you’re thinking of choosing between OpenTelemetry and OpenTracing, go for OpenTelemetry. OpenTracing is now deprecated, and users of OpenTracing are advised to migrate to OpenTelemetry.

OpenTelemetry MongoDB | Monitor and visualize your MongoDB database calls

OpenTelemetry libraries can be used to monitor MongoDB interactions. In this tutorial, we will learn how we can monitor MongoDB with OpenTelemetry libraries to analyze query execution and identify performance bottlenecks. Most modern applications have distributed architecture thanks to cloud and containerization. In cloud-native applications, it is necessary to track user requests across services and components like databases.

OpenTelemetry UI - See What's Possible With OpenTelemetry data

OpenTelemetry is a Cloud Native Computing Foundation(CNCF) project aimed at standardizing the way we instrument applications for generating telemetry data(logs, metrics, and traces). However, OpenTelemetry does not provide storage and visualization for the collected telemetry data. For visualizing OpenTelemetry data, you need an OpenTelemetry UI. The data collected by OpenTelemetry can be sent to a backend of your choice, which can then be visualized.

8 Steps to Create a Successful Cloud Strategy

In today’s digital world, performance and agility are essential for running a successful business, and in the technology arena, there is no exception. Over the past few years, there has been a significant rise in the use of cloud computing technology as more companies prefer scalability of resources, flexibility in experimenting with new technologies, reducing cost by eliminating the need to invest in on-premises hardware, etc.

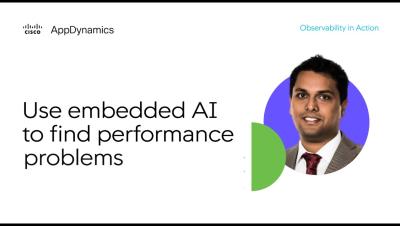
Use embedded AI to find performance problems

The root cause of a performance transaction can be complex to troubleshoot, but it does not have to be. By using AppDynamics’s built-in machine learning capabilities, we can quickly identify Health Rule violations triggered by transaction response times deviating from their baseline and then combine those with diagnostic capabilities that get us to the specific cause. We are able to drill down into the relevant snapshots to see which method and specific line of code is to blame.

Datadog on Kubernetes Node Management

Datadog, the observability platform used by thousands of companies, runs on dozens of self-managed Kubernetes clusters in a multi-cloud environment, adding up to tens of thousands of nodes, or hundreds of thousands of pods. This infrastructure is used by a wide variety of engineering teams at Datadog, with different feature and capacity needs.

SanFrancisco OpenTelemetry Meetup - Pranay from SigNoz on choosing Otel from Day 1

More about SigNoz: SigNoz - Monitor your applications and troubleshoot problems in your deployed applications, an open-source alternative to DataDog, New Relic, etc. Backed by Y Combinator. SigNoz helps developers monitor applications and troubleshoot problems in their deployed applications. SigNoz uses distributed tracing to gain visibility into your software stack.