So you’re using InfluxDB and Telegraf. Perhaps you’re writing over a million metrics points per second. Perhaps you’ve used Flux to do some data exploration. However, you now find yourself in a little bit of a pickle. You need to process and analyze this large amount of data, and you’d prefer to do that work in your favorite language with your go-to libraries.
At InfluxData, we love the community! Our amazing open source members are an integral part of InfluxData and have been since its founding. They’ve helped us build amazing products for time series data. This is a quick update to give you some insight into how we track metrics about our community and ensure we are building products and features that our users want to see.
If you followed the tutorial I presented a couple of years ago about integrating Particle.io with InfluxDB and were unhappy, or simply couldn’t get it working, have I got a treat for you! Integrating Particle.io with InfluxDB Cloud is very straightforward and requires no outside services or customizations outside of what Particle Cloud already offers. Here are the steps to get it all working.
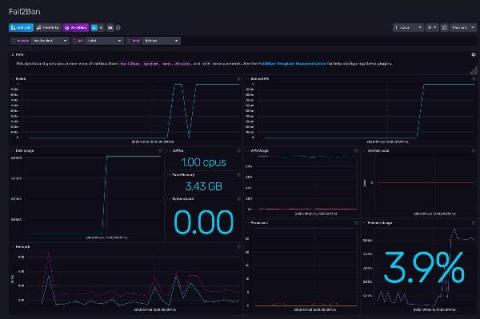
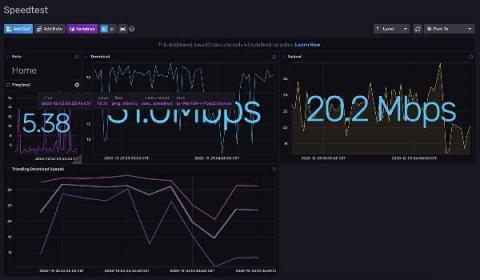
With InfluxDB 2.0 we added the ability to export a configuration of your entire stack, and import it again into another instance of InfluxDB. This includes your InfluxDB buckets, dashboards, queries, alerts and even Telegraf configurations. Since many people have the same or similar use cases, we wanted to provide a way for you to share your configurations with other users, and work together to enhance and improve them over time, just like you would any other open source project.
I’ve built a lot of InfluxDB servers in my time here, and I’ve built some pretty esoteric ones at that, but I think I’ve finally pulled off what can only be described as the World’s Smallest InfluxDB Server! Back in the summer of 2019, I saw a project on CrowdSupply.com for something called the ‘Giant Board’. It looked really, really cool! A complete Single Board Computer (SBC) that ran Linux, all in a Feather form factor. I immediately backed it!
Jupyter Notebooks are wonderful because they provide a way to share code, explanations, and visualizations in the same place. Notebooks add narrative to computation. The cells compartmentalize steps and reduce the fear or hesitation associated with editing code. In this way, notebooks act as an invitation for experimentation. Today, I want to extend that invitation and apply it to InfluxDB. In this post, we’ll learn how to query our system stats data from InfluxDB v2.0 using Flux.
At the end of 2019, we released a new Suricata input plugin with Telegraf 1.13.0. In this blog, I’ll talk about the the powerful combination of these two open source products — the importance of Suricata and why you should use Telegraf to monitor its performance. I wanted to start off first thanking Sascha Steinbiss for submitting this plugin. Here at InfluxData, we can’t tell you how much we value our open source community.
Today we’re excited to announce the general availability of InfluxDB Cloud for Google Cloud. With this new service, GCP users can now use our leading time series data platform on Google infrastructure. This lets you address a wide range of use cases: server monitoring, IoT sensor data tracking, real-time customer analytics, application performance metrics, network monitoring, security threat detection, and financial market analysis.