Operations | Monitoring | ITSM | DevOps | Cloud

InfluxData

Tim Hall [InfluxData] | Dashboards as Code | InfluxDays London 2019

We are all used to building dashboards for great visualizations, but the issue becomes how to share and collaborate on instrumentation and dashboard design. In this talk, Tim Hall will drill down on dashboard sharing, how to iterate and improve on dashboards within a repository, and lessons learned in sharing and collaborating on dashboards.

Noah Crowley [InfluxData] | Using the Java Client Library | InfluxDays London 2019

InfluxDB 2.0 brings in support for many new client libraries. In this session, Noah will walk through how to use the new Java client library to access InfluxDB 2.0. InfluxDB comes with a new set of client libraries to allow you to insert time series data from your applications into the new InfluxDB 2.0. Specifically, Noah will share how to use the Java client library to insert data and query it in your applications.

Gianluca Arbezzano [InfluxData] | Kubernetes Monitoring with InfluxDB 2.0 & Flux | InfluxDays London

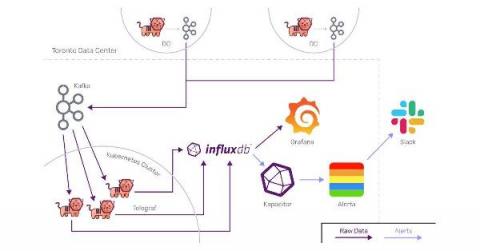
Gianluca will dig deep into how to monitor Kubernetes with InfluxDB using lessons learned from building and running InfluxDB Cloud on Kubernetes. He will cover what metrics should be collected, when to use push and pull metric collection, and the role that Prometheus plays in any K8s monitoring environment.

Russ Savage [InfluxData] | Monitoring, Alerting, and Tasks as Code | InfluxDays London 2019

In this talk Russ will explore how to build tasks, alerting rules, and triggering events inside of InfluxDB 2.0 with the new Flux language. Russ will then showcase how to work this into a regular development flow by using command line tools for testing, source control as the source of truth, and testing against production data.

David Kaltschmidt [Grafana Labs] | Mixing metrics & Logs with Grafana + InfluxDB |

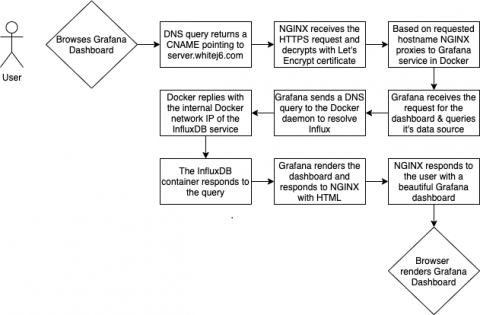
Grafana’s new Explore area is adding support for both metric and logs display for the Influx datasource. This allows you to quickly access your metrics, and as part of troubleshooting, bring up related logs. We’ll also look at the latest support for Flux inside Grafana.