Operations | Monitoring | ITSM | DevOps | Cloud

Grafana

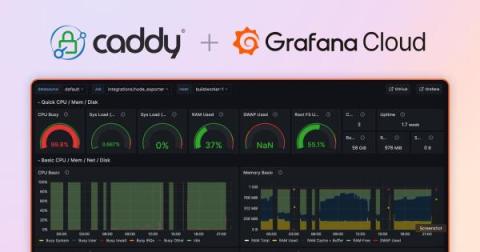
How the open source Caddy server uses Grafana Cloud for full-stack observability

Mohammed Al Sahaf serves as Technical Product Manager at Samsung Electronics Saudi Arabia. Outside his day job, he serves with the Caddy team to tackle the web of problems facing web servers in the third millennium. Mohammed is the author of Kadeessh, formerly caddy-ssh, and the maintainer of numerous Caddy modules. When he isn’t programming, he is trying to catch up on life and sleep with the help of coffee.

How to instrument your Python application using OpenTelemetry

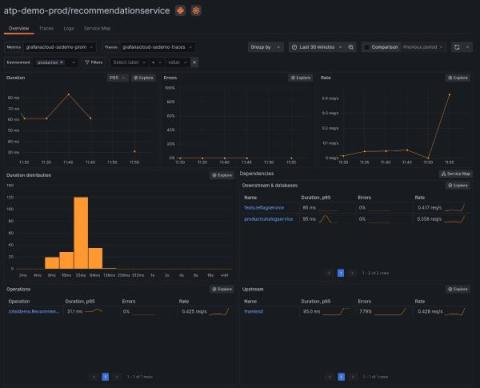
If you want to see if OpenTelemetry helps you become a better Python developer — or if you just want to know how to add OpenTelemetry to your Python service — you’ve come to the right place. In this blog, we’ll show you how to instrument your Python application using OpenTelemetry and how to visualize your OpenTelemetry data using Application Observability in Grafana Cloud. We’ll walk you through the following steps.

OpenTelemetry: 3 questions to ask before choosing an observability solution

As OpenTelemetry rises in popularity, more organizations are implementing, or planning to implement, the open source project to monitor their applications — and, meanwhile, more vendors are offering OpenTelemetry support. In fact, a quick Google search for “OpenTelemetry support” shows results ranging from legacy APM vendors to newer, cloud native solutions like Grafana Cloud.

How to start with Kubernetes monitoring in Grafana Cloud

This video provides a comprehensive guide to initiating Kubernetes monitoring within Grafana Cloud, detailing a straightforward, step-by-step approach for installing the Helm chart on your cluster. It further ensures that you can validate the health and integrity of the data underpinning the solution, setting a solid foundation for effective monitoring practices. Ideal for both beginners and experienced users, this tutorial is designed to streamline your monitoring setup process with precision and ease.

Kubernetes alerting: Simplify anomaly detection in Kubernetes clusters with Grafana Cloud

Despite the widespread adoption of Kubernetes, many DevOps teams and SREs still struggle to troubleshoot issues because of all the complexity that comes with the open source container orchestration platform. That’s why we developed Kubernetes Monitoring, an application in Grafana Cloud you can use to visualize and alert on your Kubernetes clusters.

'The Story of Grafana' documentary: From one developer's dream to 20 million users worldwide

On Dec. 5, 2013, Torkel Ödegaard made the first commit in GitHub for a personal project that would become Grafana. “It’s hard to believe it’s been 10 years since Torkel launched Grafana, growing from a small man with a big dream to becoming the most popular data visualization software in the world,” says Grafana Labs co-founder and CEO Raj Dutt. “The Story of Grafana” chronicles that meteoric journey.

Introducing Grafana 10.3

Grafana 10.3 is here! From improving your ability to create and navigate complex canvas panels to monitoring via anonymous access control, this release is all about enhancing efficiency and clarity in your observability journey. In this video, learn more about: Canvas Pan and Zoom Improved Tooltips Metric Analysis Alerting enhancements Multi-stack data sources Anonymous access control Stay with us through this playlist to delve deeper into each addition and maximize your Grafana 10.3 experience.