Operations | Monitoring | ITSM | DevOps | Cloud

logz.io

Observability is Still Broken. Here are 6 Reasons Why.

In an era where there’s no shortage of established best practices and tools, engineering teams are consistently finding their ability to prevent, detect and resolve production issues is only getting harder. Why is this the case? Our most recent DevOps Pulse Survey highlighted alarming trends to this end.

Modern Canadian MSSP drives next-gen MDR with Logz.io and Tines

Today’s Managed Security Service Providers (MSSPs) are trying to grow their business quickly, improving margins and onboarding customers with high-quality tool sets that scale with the business. This means reducing cost, improving onboarding time and building the next generation of Managed Detection and Response (MDR) to deal with threats that are increasing in volume and sophistication.

Platform Engineering: DevOps Evolution or a Fancy Re-name?

Everyone’s talking about Platform Engineering these days. Even Gartner recently featured it in its Hype Cycle for Software Engineering 2022. But what is Platform Engineering really about? Is it the next stage in the evolution of DevOps? Is it just a fancy rebrand for DevOps or SRE? As a veteran of the PaaS (Platform as a Service) discipline about a decade ago, and a DevOps enthusiast at present, I decided to delve into this topic, peel off the hype, and see what it’s about in practice.

Cracking Performance Issues in Microservices with Distributed Tracing

Microservices architecture is the new norm for building products these days. An application made up of hundreds of independent services enables teams to work independently and accelerate development. However, such highly distributed applications are also harder to monitor. When hundreds of services are traversed to satisfy a single request, it becomes difficult to investigate system issues.

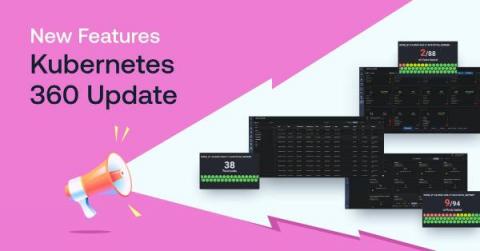
Unified Observability: Announcing Kubernetes 360

Ask any cloud software team using Kubernetes (and most do); this powerful container orchestration technology is transformative, yet often truly challenging. There’s no question that Kubernetes has become the de-facto infrastructure for nearly any organization these days seeking to achieve business agility, developer autonomy and an internal structure that supports both the scale and simplicity required to maintain a full CI/CD and DevOps approach.

Zen and the Art of Kubernetes Monitoring

The real beauty of this modern, cloud-fueled, DevOps-driven world that we are living in is that it’s so highly composable. In so many ways, we’ve been freed from the limitations and structures of the previous annals of software and technology history to build things the way that we want to, and however we choose to do so.

The Open Source Observability Adoption and Migration Curve

Open source monitoring and observability tools can be found in production all over the world – whether they’re being used by startups or entire enterprise development teams. DevOps, ITOps, and other technical teams rely on tools like Prometheus, Grafana, OpenSearch, OpenTelemetry, Jaeger, Nagios, Zabbix, Graphite, InfluxDB, and others to monitor and troubleshoot their cloud environment.

How Logz.io Uses Observability Tools for MLOps

Logz.io is one of Logz.io’s biggest customers. To handle the scale our customers demand, we must operate a high scale 24-7 environment with attention to performance and security. To accomplish this, we ingest large volumes of data into our service. As we continue to add new features and build out our new machine learning capabilities, we’ve incorporated new services and capabilities.

Tips and Tricks for the Small SOC: Part II

It’s Cybersecurity Awareness Month, and in that spirit, we’re offering a number of tips and tricks small security operations center (SOC) teams can use. I started my career working as part of a small SOC team, and working with other security experts here at Logz.io, we’re happy to offer these to small SOC teams who can often use all the help they can get! In the last post, we talked about managing security talent and building processes.

Observability Is a Data Analytics Problem

Observability is a hot topic in the IT world these days. It is oftentimes discussed through the lens of the “three pillars of observability”: Logs, Metrics and Traces. Indeed these telemetry signal types help us understand what happened, where it happened and why it happened in our system.