Operations | Monitoring | ITSM | DevOps | Cloud
How to sign up for Elastic Cloud on the AWS Marketplace
How to autoscale your Elastic Cloud deployment
How to automate verification of deployments with Argo Rollouts and Elastic Observability
Shipping complex applications at high velocity lead to increased failures. Longer pipelines, scattered microservices, and more code inherently lead to bigger complexity where small mistakes may cost you big time.
Elastic on Elastic - Using Elastic Observability to optimize the performance of detection rules in Elastic Security
Elastic Security’s developer support team has recently seen a surge in reports from customers about sluggish performance in our UI. Our initial inspection of logs for troubleshooting provided some insights, but not enough for a true fix. Luckily, we have Elastic Observability and its APM capabilities to dive in deeper and look under the hood at what was really happening within Elastic Security. And, more importantly, how we could improve its performance for customers.
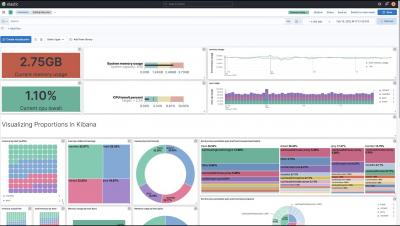
8 ways to visualize proportions in Kibana
Better search can help government serve people when they need it most
As citizens, we interact with the government at various points in our lives. Many interactions serve as important rites of passage like obtaining a marriage or business license, claiming a new dependent on a tax return, or filing for retirement benefits. Other interactions serve as a safety net like obtaining financial assistance after a disaster or reporting a scam attempt. No matter the reason for transacting with the government, citizens want the interaction to be as frictionless as possible.
Elastic Observability 8.1: Visibility into AWS Lambda, CI/CD pipelines, and more
Technologies such as serverless computing frameworks and CI/CD automation tools help accelerate software development lifecycles (SDLC) to give development teams a competitive edge in the marketplace. Armed with these technologies, teams can deploy and innovate faster and more frequently by automating repetitive tasks and eliminating the need to manage or provision servers.
Elastic Enterprise Search 8.1: Enhanced web crawling and SharePoint on-prem connectivity
The 8.1 release of Elastic Enterprise Search features faster and more efficient content ingestion with the latest enhancements to the Elastic web crawler, with additional troubleshooting capabilities as well. This release also features the addition of SharePoint Server to our library of prebuilt connectors to enable aggregation of on-premises SharePoint Server content into Elastic for seamless search.


