Operations | Monitoring | ITSM | DevOps | Cloud
That's A Data Problem - The New Normal | Daniel Newman & Splunk's Kristen Robinson
Art of Data: Bringing Data to Esports
You may have seen the announcement that Splunk and McLaren Racing have expanded their partnership, which sees Splunk as an Official Global Partner of the McLaren Shadow Esports team and the Logitech McLaren G Challenge. As a budding Esports fan and data enthusiast, it’s really exciting to see these two worlds collaborate and accelerate the virtual racing experience.
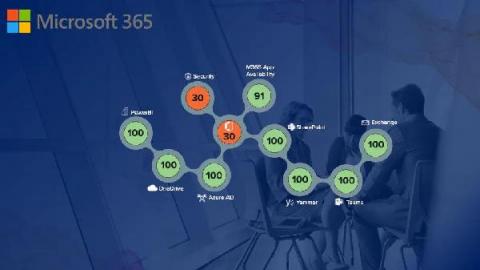
Microsoft 365: Are You Flying Blind...and at What Cost?
Many organizations today are migrating from on-prem solutions for email / calendar / communications to Microsoft 365. If this is you, this is your productivity cloud across work and life, designed to help you achieve more with innovative Office apps, intelligent cloud services, and world-class security.
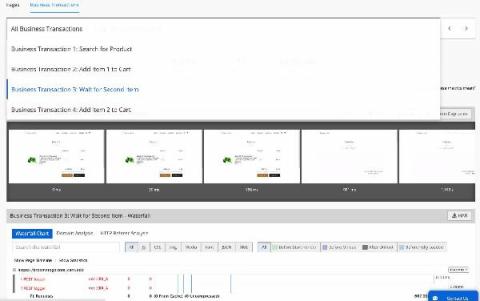
Understanding Where You Fit in the Web Performance Maturity Curve
We all know that faster is better. Research and results clearly indicate that faster experiences with fewer errors result in increased usage, conversion, and revenue. With the desire to improve business metrics in mind, organizations often seek immediate improvements in customer experience across digital properties. However, without proper planning and coordination, these attempts consistently fail.
A day in the life of cybersecurity. Splunk customer stories of SOC-cess
We have a saying at Splunk. It goes something like “if you’re ever having a bad day, go and talk to a customer”. What organizations around the world are doing with their data and Splunk brings a huge smile and an eyebrow raising, positive “can’t quite believe you’ve done that” very-impressed nod of the head. That’s never more true than with our security customers.
What Top Brands Are Saying About Splunk Observability Cloud
Customers have had a lot to say about the new Splunk Observability Cloud since we announced general availability on May 5, 2021. For the first time ever, IT and DevOps teams can get all their data in one place with unified metrics, traces and logs — collected in real time, without sampling and at any scale. What makes Splunk Observability Cloud unique from other solutions? We’ll let our customers do the talking.


