Operations | Monitoring | ITSM | DevOps | Cloud
Why Seven.One Entertainment Group Chose Datadog RUM for Client-side Observability
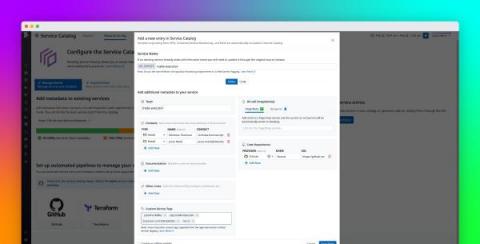
Easily add tags and metadata to your services using the simplified Service Catalog setup
Modern applications running on distributed systems often complicate service ownership because of their ever-growing web of microservice dependencies. This complication challenges engineers’ ability to shepherd their software through every stage of the development life cycle, as well as teams’ ability to train new engineers on the application’s architecture. With increased complexity, clarity is key for quick, effective troubleshooting and delivering value to end users.
Datadog On Reliability Engineering
Why Whatnot Chose Datadog Synthetic Monitoring to Automate Backend Testing
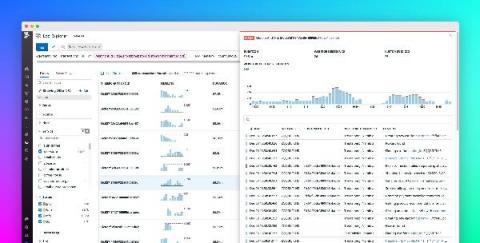
Analyze causal relationships and latencies across your distributed systems with Log Transaction Queries
Modern, high-scale applications can generate hundreds of millions of logs per day. Each log provides point-in-time insights into the state of the services and systems that emitted it. But logs are not created in isolation. Each log event represents a small, sequential step in a larger story, such as a user request, database restart process, or CI/CD pipeline.
Troubleshoot faulty frontend deployments with Deployment Tracking in RUM
Many developers and product teams are iterating faster and deploying more frequently to meet user expectations for responsive and optimized apps. These constant deployments—which can number in the dozens or even hundreds per day for larger organizations—are essential for keeping your customer base engaged and delighted. However, they also make it harder to pinpoint the exact deployment that led to a rise in errors, a new error, or a performance regression in your app.
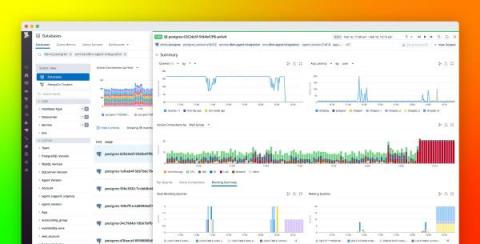
Troubleshoot blocking queries with Datadog Database Monitoring
Blocked queries are one of the key issues faced by database analysts, engineers, and anyone managing database performance at scale. Blocking can be caused by inefficient query or database design as well as resource saturation, and can lead to increased latency, errors, and user frustration. Pinpointing root blockers—the underlying problematic queries that set off cascading locks on database resources—is key to troubleshooting and remediating database performance issues.
How Delivery Hero uses Kubecost and Datadog to manage Kubernetes costs in the cloud
As the world’s leading local delivery platform, Delivery Hero brings groceries and household goods to customers in more than 70 countries. Their technology stack comprises over 200 services across 20 Kubernetes clusters running on Amazon EKS. This cloud-based, containerized infrastructure enabled them to scale their operation to support increasing demand as the volume of orders placed on their platform doubled during the pandemic.
Optimize Kubernetes workload resourcing with StormForge and Datadog
StormForge Optimize Live is a machine learning-powered performance and resource optimization solution for Kubernetes workloads. Optimize Live ingests and analyzes production observability data and recommends specific actions to optimize CPU and memory utilization. You can take these actions manually or set them to occur automatically, making it easier to maintain a high level of application performance while minimizing cloud costs.


