Operations | Monitoring | ITSM | DevOps | Cloud
Monitor the state of your Tailscale private network with Datadog
Tailscale is a modern remote access solution that allows customers to easily scale, segment, and manage a private network as their business grows. It enables encrypted point-to-point connections using the open source WireGuard protocol, so that devices on your private network can only communicate with each other.
Secure and monitor infrastructure networking with Buoyant Enterprise for Linkerd in the Datadog Marketplace
As organizations adopt Kubernetes, they face gaps in security, reliability, and observability such as unencrypted communication, lack of multi-cluster support, and missing reliability features like circuit breaking. Buoyant Cloud is the dashboarding and automated monitoring component of Buoyant Enterprise for Linkerd, which helps organizations secure and monitor communication between Kubernetes workloads.
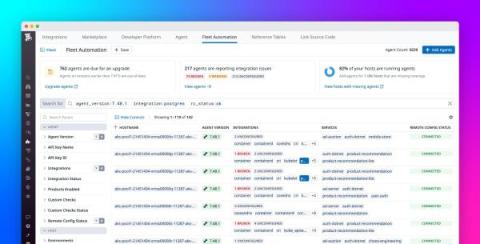
Centrally govern and remotely manage Datadog Agents at scale with Fleet Automation
As customers scale to thousands of hosts and deploy increasingly complex applications, it can be difficult to ensure that every host is configured to give you the visibility you need to monitor your infrastructure and applications. To ensure visibility across a growing number of hosts, you need to know that your observability strategy is implemented uniformly across your entire fleet of Datadog Agents installed on these hosts.
Chasing the Rainbow: Towards Unified Service Metrics
Datadog on Kafka #kafka
Datadog acquires Actiondesk
Datadog customers have an abundance of observability data at their fingertips. Using this data effectively requires having the right visualizations and analysis tools. For some teams, the powerful functionality of spreadsheets is critical to their ability to make data-driven forecasting and business decisions. That’s why we are pleased to announce that Actiondesk—a spreadsheet-powered connection to your live data—is joining Datadog.
How Mercado Libre scales its AWS microservices without losing visibility
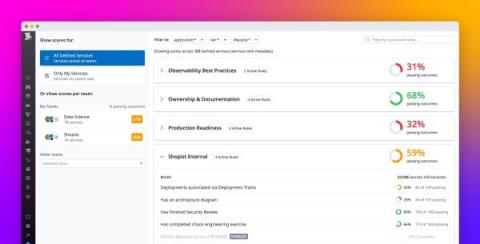
Formalize your organization's best practices with custom Scorecards in Datadog
The Datadog Service Catalog is a centralized hub of information around the performance, reliability, security, efficiency, and ownership of your distributed services. By using the Service Catalog, teams can eliminate knowledge silos and realize seamless DevSecOps workflows.
How we manage incidents at Datadog
Incidents put systems and organizations to the test. They pose particular challenges at scale: in complex distributed environments overseen by many different teams, managing incidents requires extensive structure and planning. But incidents, by definition, break structures and foil plans. As a result, they demand carefully orchestrated yet highly flexible forms of response. This post will provide a look into how we manage incidents at Datadog. We’ll cover our entire process.


