

Operations | Monitoring | ITSM | DevOps | Cloud

Logging + Trace: love at first insight

Meet Stackdriver Logging, a gregarious individual who loves large-scale data and is openly friendly to structured and unstructured data alike. Although they grew up at Google, Stackdriver Logging welcomes data from any cloud or even on-prem. Logging has many close friends, including Monitoring, BigQuery, Pub/Sub, Cloud Storage and all the other Google Cloud services that integrate with them. However, recently, they are looking for a deeper relationship to find insight.
Stackdriver Sandbox - Stack Doctor

Want to get started with Stackdriver without impacting your production monitoring setup? Join Yuri Grinshteyn to learn how to use the Stackdriver Sandbox to start learning about and using Stackdriver. The Sandbox includes a GKE cluster with a sample microservices application deployed and fully instrumented for monitoring, logging, and tracing.

SLOs with Stackdriver Service Monitoring

Service Level Objectives or SLOs are one of the fundamental principles of site reliability engineering. We use them to precisely quantify the reliability target we want to achieve in our service. We also use their inverse, error budgets, to make informed decisions about how much risk we can take on at any given time. This lets us determine, for example, whether we can go ahead with a push to production or infrastructure upgrade.

How to use Stackdriver monitoring export for long-term metric analysis

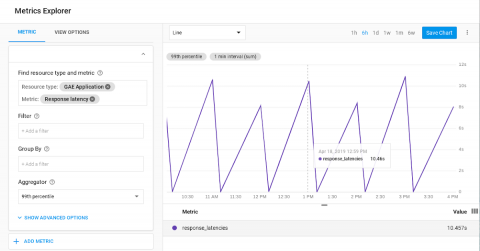
Our Stackdriver Monitoring tool works on Google Cloud Platform (GCP), Amazon Web Services (AWS) and even on-prem apps and services with partner tools like Blue Medora’s BindPlane. Monitoring keeps metrics for six weeks, because the operational value in monitoring metrics is often most important within a recent time window. For example, knowing the 99th percentile latency for your app may be useful for your DevOps team in the short term as they monitor applications on a day-to-day basis.