Operations | Monitoring | ITSM | DevOps | Cloud
Squared Up
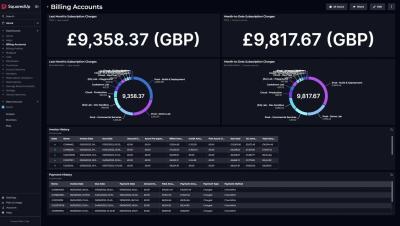
How-to surface your multi-cloud costs with SquaredUp
Working in the cloud is certainly convenient, but the convenience comes at a price. With more and more organizations transitioning to the cloud, and a rise in preference towards cloud-native applications, hosting most, if not all the components of your business in the cloud is becoming increasingly common.
Correlate AWS and Prometheus with SquaredUp's data mesh
I recently delved into the idea of using labels within Prometheus to craft objects and hierarchies where none initially existed. Check out that piece here. The essence was harnessing the prowess of OTEL to achieve more, faster. The ambition? Transform these abstract virtual objects and integrate them into SquaredUp's knowledge graph, thereby unlocking the potential of data mesh and correlation.
Combining AWS and Prometheus with OpenTelemetry
In the realm of data and complex scenarios, we humans naturally gravitate towards visualizing things as entities with attributes, rather than just raw data. Consider the phrase, “The response time on our Ad Generation service has increased.” It immediately resonates with the audience supporting the service.
What's new in SquaredUp: 2023 June - Dec highlights
As 2023 draws to a close, we’re celebrating a full year since the release of SquaredUp Cloud – our revolutionary observability portal for product, engineering, and IT teams. In the last six months, we’ve packed in a ton of product improvements, including new visualizations, even more out-of-the-box dashboards, and a fast growing suite of pre-built plugins.
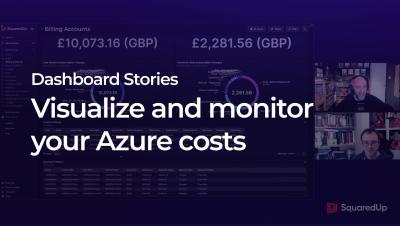
Monitoring Azure cost with SquaredUp
Gartner IOCS replay: Achieving unified observability with data mesh
The single pane of glass is perhaps the most enduring and elusive goal of enterprise IT operations teams. When we polled our customers a couple of years ago, out of 184 respondents, 99% of them rated it as important to their business – with 64% indicating “extremely important”. The shared dream is to have: But unfortunately, the single pane of glass has become a bit of myth.
How to measure engineering team health
At SquaredUp, we have been debating how the senior leadership team can monitor the ‘health’ of our engineering teams. To do this, we decided to create a dashboard that could represent this for a team – but first, we needed to figure out what to measure. Our goal was to better understand our teams to inform which actions to take to support them and make them a happier and more productive bunch.
Virtual Customer Workshop 2023
Last week, we were very excited to host our first ever SquaredUp Virtual Customer Workshop! We’d received so much positive feedback on the intimate in-person workshop we ran in the UK last month that we wanted to extend the invitation worldwide – by recreating the experience virtually. Using the digital conferencing app Gather Town, we were pleased to welcome 23 SquaredUp customers from 12 countries to our virtual “SquaredUp Town”.
Dashboarding Azure Monitor SCOM MI in SquaredUp
Big news! Microsoft have just dropped Azure Monitor SCOM Managed Instance (SCOM MI), their cloud-based alternative to SCOM. It’s fully Microsoft managed, and so it promises to take the headache out of deploying, scaling, and managing your SCOM Management Groups. Read Microsoft’s announcement blog to learn all about it.


