Operations | Monitoring | ITSM | DevOps | Cloud
k8s-monitoring-helm Chart Office Hours (April 2026)
In the April edition of the Kubernetes Monitoring Helm chart office hours, we discuss updates to the version 4.0 release, the upcoming 4.1 feature release, and we discuss the upcoming deprecation of the 1.x and 2.0 versions.
k6 Script Authoring mode for Grafana Assistant
Here's Senior Software Engineer Vicente Ortega showcasing something he's built: the new k6 Script Authoring mode for Grafana Assistant.
Grafana Assistant: Now Available in Self-Managed Environments
You can now access Grafana Assistant in self-managed environments! See why the feedback has been so strong.
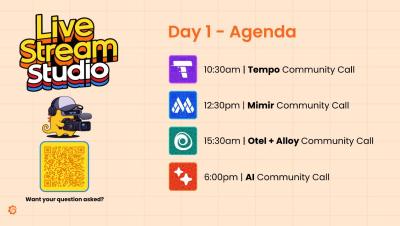
Alloy, OpenTelemetry & Instrumentation Community Call LIVE from GrafanaCON 2026
Join us live from GrafanaCON 2026 for the Alloy, OpenTelemetry & Instrumentation Community Call! We’re kicking things off with a look at everything happening across Alloy and the OpenTelemetry ecosystem, alongside special guests Ted Young, Mischa Thompson, and Liudmila Molkova. In this session: We take a look back at Alloy’s rapid growth and adoption Explore the introduction of the new OpenTelemetry Engine Dive into fleet management, instrumentation, and onboarding at scale.
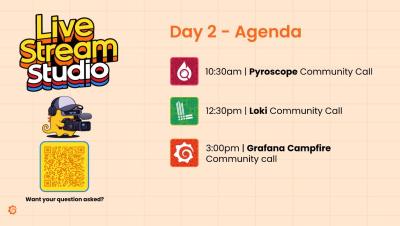
Loki Community Call LIVE from GrafanaCON 2026
Join us live from GrafanaCON 2026 for the Loki Community Call! We’re kicking things off with a look at everything happening in the Loki ecosystem, alongside special guests Poyzan Taneli, Ben Clive, and Trevor Whitney. In this session: We take a look back over the last year in Loki Explore the brand new “Thor” architecture Dive into what’s coming next for logging at scale From a completely new columnar storage format and Kafka-based ingestion, to a redesigned query engine and improved support for high-cardinality data—Loki is evolving to meet the demands of modern logging.
Pyroscope Community Call LIVE from GrafanaCON 2026
Join us live from GrafanaCON 2026 for the Pyroscope Community Call! We’re kicking things off with a look at everything happening in the Pyroscope ecosystem, alongside special guest Alberto Soto. In this session: We take a look back over the last year in Pyroscope What’s new in continuous profiling What’s coming next From multi-language source code integration and symbolization improvements to OpenTelemetry profiles and performance gains, Pyroscope has evolved rapidly over the past year.
Git Sync: Observability as code built for scale | Demo | Grafana Labs
In this video, Fabrizia Rossano and Roberto Jiménez demonstrate Git Sync, a feature that provides you with the power of Git version control right in your Grafana instance. Git Sync enables you to submit changes in your dashboards as pull requests and get them reviewed by your team directly from Grafana or from Git.
Smarter Visualization Suggestions in Grafana 13
Grafana 13 upgrades visualization suggestions — now the default way to pick a panel type — with grouped options and full previews that help you find the right visualization faster.
Grafana 13 TL;DR - What's New (and Worth Your Time)
Grafana 13 is here! In this video, we walk through the biggest updates and improvements, from faster ways to build dashboards to new features that make Grafana easier to manage at scale. We cover things like: If you’ve ever struggled with broken dashboards, messy layouts, or just getting started from scratch, this release focuses on making those workflows a lot smoother. This is a TL;DR, so we’re just scratching the surface—but it should give you a solid sense of what’s new and what’s worth checking out.


