Simplify Cloud Data Onboarding with the NEW Data Manager
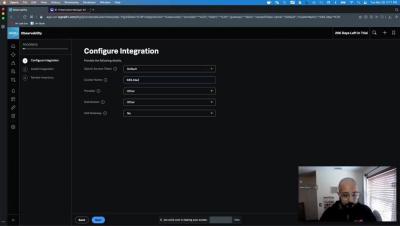
We understand that getting data into Splunk Cloud can be cumbersome and repetitive. This is why we are excited to introduce Data Manager - Now in preview! Data Manager is a new modernized, simplified, and automated experience for onboarding cloud-native data sources such as AWS.