Welcome to the October edition of **"What's New at Kentik"**! Join host Leon Adato as he navigates through the latest updates and happenings at Kentik—with a dash of humor and a sprinkle of sarcasm.
In this latest Kentik Bytes, we explore how Kentik Data Explorer empowers cloud engineers to gain visibility across distributed, multi-cloud environments. With the ability to query and analyze vast amounts of telemetry from AWS, Azure, Google Cloud, and on-premises environments, Kentik simplifies troubleshooting and cost optimization. We walk through how to filter data, use custom dimensions, and compare historical data to get deeper insights, all in one platform.
We’re running down the latest developments, releases, and features in the latest What’s New at Kentik. This episode features improvements in report processing, enhanced report features, and updated Synthetics alerting to transform data into actionable insights. Remember to like and subscribe for more Kentik product updates each month!
In AWS, even a tiny misconfiguration in security groups or routing tables can lead to significant traffic blockages. Watch this short demo highlighting how Kentik can diagnose these issues and use enriched flow data and contextual analysis to find the root cause of traffic blockages.
Are performance-impacting hybrid and multi-cloud issues affecting your business’ happiness? Introducing Kentik (Observabilium) Daily, a revolutionary new full-featured solution to your organization’s cloud network observability needs.
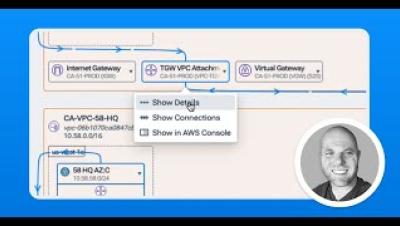
Phil Gervasi shows the importance of understanding traffic over AWS Transit Gateways for cloud cost management. He demonstrates how Kentik provides a visual layout of the entire AWS environment, including Transit Gateways, and allows users to dig into specific details and metrics. Phil also gives a quick look at Data Explorer, where users can observe Transit Gateway traffic over time, create and edit filters, and customize data visualization for sharing and exporting.
Host Leon Adato takes you through the latest updates and features from Kentik. This month, we dive into monitoring analytics for content distribution networks (CDNs), explore the new Use Case Finder in Kentik's knowledgebase, and learn how to include custom fields in Data Explorer. Plus, Leon shares some light-hearted insights on why August is the perfect time to celebrate with Kentik's... uhh... craft brews? Don't forget to like and subscribe to keep up-to-date on everything new at Kentik!
Phil Gervasi introduces a method for identifying idle resources in AWS using the Kentik platform. By selecting dimensions such as Logging Status, Observing VPC ID, and Observing Region, users can filter the data to determine if a resource is actually doing anything from a network perspective. “No Data” messages indicate resources with no network activity, and a more specific filter can be created based on this message to isolate idle resources. By adjusting the time frame and observing bits per second, users can determine how long resources have been idle.
Phil Gervasi introduces a quick and easy way to see network performance metrics among multiple cloud instances. Synthetic tests can be deployed in multiple public clouds to test for loss, latency, and jitter among public cloud instances, such as between AWS and Azure. Phil demonstrates the ability to adjust the time range and shows inbound and outbound traffic, average latency, packet loss, and jitter. A spike in any of these metrics would trigger an alert tied to the ticketing system. He also shows the ability to click into the path view between cloud instances to see a hop-by-hop breakdown.
Multi-cloud visibility is a challenge for most IT teams juggling multiple tools and screens to understand application traffic across multiple public clouds. Kentik unifies telemetry from the major cloud providers and the public internet into one place to give you the ability to monitor and troubleshoot application performance across AWS, Azure, Google, and Oracle clouds for real-time and historical analysis.