Operations | Monitoring | ITSM | DevOps | Cloud

Latest Posts

Make Time for Smarter Business Decisions

Whether or not you’re familiar with time-series data, it has a significant impact on your life – and your business. If you aren’t using it, you’re missing out. If you are using it, you may not be getting the most out of it. First things first, let’s define time-series data. Simply stated, it’s any series of data points recorded with accompanying time stamps, usually as a sequence recorded at equally spaced intervals.

Tuning AWS EC2 instances with CloudWatch metric analysis

What happens when cloud-based application infrastructure slows down? Twelve years ago, I attended a meetup at the San Francisco Perl Mongers group where an engineer from Amazon introduced the Elastic Compute Cloud service (EC2). At the time, anyone involved with computing infrastructure either racked their own servers or used managed hosting where someone else took care of the pipes, power, and ping.

Which block I/O scheduler is the best? We asked eBPF

eBPF tracing is a broad and deep subject, and can be a bit daunting at first sight. However, when Brendan Gregg issued the dictum “Perhaps you’d like a new year’s resolution: learn eBPF!”, I figured it was as good a time as any to do something fun with it. Here at Circonus, we’ve talked about eBPF previously, so I had a starting point to look for an interesting problem to solve.

Faultd Update - Next Generation Alerting

Circonus will soon be releasing our next generation fault detection system, faultd (fault-dee). Faultd is an internal component of our infrastructure has run alongside our existing fault detection system for several months with outputs verified for accuracy. Additionally it is in use by some of our enterprise customers who have reported no issues with faultd.

How Safe is Your Home's Air? The Internet of Things and Air Quality Monitoring during Wildfires

Over the past few weeks, the Camp Fire in Northern California and the Woolsey Fire in Southern California have devastated people and property. There has been tragic loss of life in the town of Paradise, and California’s firefighters remain tasked, once again, with the difficult job of containing and extinguishing the flames. What no one can contain, though, is the spread of hazardous wildfire smoke.

Introducing Circonus Stream Tags

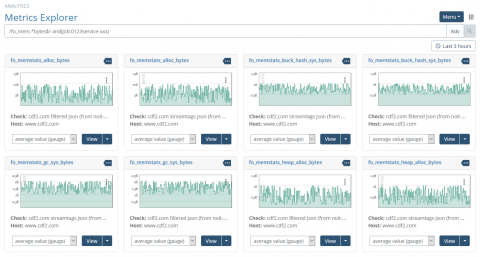
A “metric” is a measurement, or value, representing the operational state of your system at a given time. For example, the amount of free memory on a web host, or the number of users logged into your site at a given time. Factor in hundreds (or thousands) of hosts, availability zones, hardware batches, or service endpoints, and you’re suddenly dealing with a significant logistical challenge.

The Problem with Percentiles - Aggregation brings Aggravation

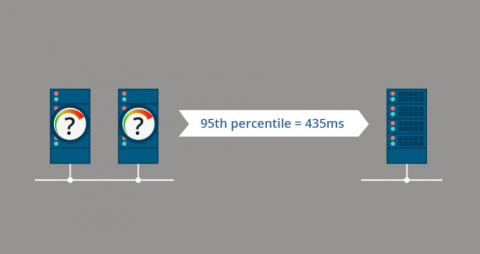
Percentiles have become one of the primary service level indicators to represent real systems monitoring performance. When used correctly, they provide a robust metric that can be used for base-of-mission critical service level objectives. However, there’s a reason for the “when used correctly” above.

A Guide to Service Level Objectives, Part 3: Quantifying Your SLOs

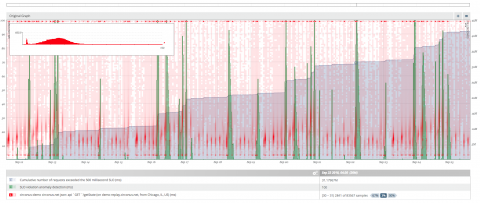
As we’ve discussed in part one and part two of this series, Service Level Objectives (SLOs) are essential performance indicators for organizations that want a real understanding of how their systems are performing. However, these indicators are driven by vast amounts of raw data and information. That being said, how do we make sense of it all and quantify our SLOs? Let’s take a look.