Operations | Monitoring | ITSM | DevOps | Cloud

Latest Posts

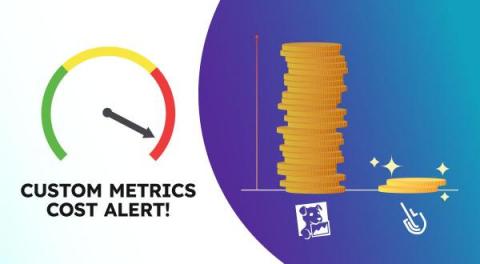
Did Your Datadog Bill Explode?

Custom metrics is a key component for many companies. Stock available in warehouses, shopping cart status, number of products sold, and operational status for industrial machines are some of the many KPIs that companies need for their own business tracking purposes. When it comes to custom metrics and observability platforms costs, many companies are struggling to find a good balance between availability, performance, reliability, and costs.

Top metrics for Elasticsearch monitoring with Prometheus

Starting the journey for Elasticsearch monitoring is crucial to get the right visibility and transparency over its behavior. Elasticsearch is the most used search and analytics engine. It provides both scalability and redundancy to provide a high-availability search. As of 2023, more than sixty thousand companies of all sizes and backgrounds are using it as their search solution to track a diverse range of data, like analytics, logging, or business information.

What's New in Sysdig - March & April 2023

This month, Sysdig Secure’s Container Registry scanning functionality became generally available for all users. This functionality provides an added layer of security between the pipeline and runtime scanning stages. On Sysdig Monitor, we introduced a feature to automatically translate Metrics alerts in form-based query to PromQL. This allows you to choose between the convenience of form and the flexibility of PromQL.

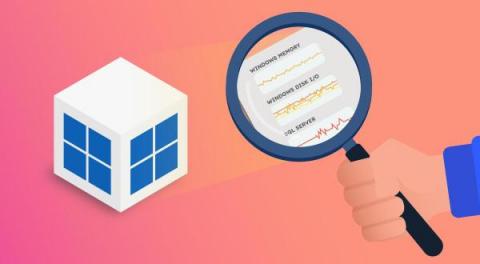
How to Monitor Your Windows Infrastructure

Nowadays many organizations still rely on classic Windows servers and virtual machines (VMs) for their business applications. Although Kubernetes is a trending topic, not everything running in the cloud is a container-based application. When it comes to monitoring Windows applications and infrastructure, many businesses leverage OSS Prometheus to get Windows metrics via its Prometheus Windows Exporter.

Sysdig Validated as AWS CloudOps Competency Launch Partner

This week AWS unveiled its new Cloud Operations Competency–aka the CloudOps Competency–designed to recognize qualified partners who help cloud customers build and manage hybrid cloud environments securely and efficiently. Sysdig is a launch partner and is now validated for the AWS CloudOps Competency in Compliance and Auditing, as well as Monitoring and Observability categories.

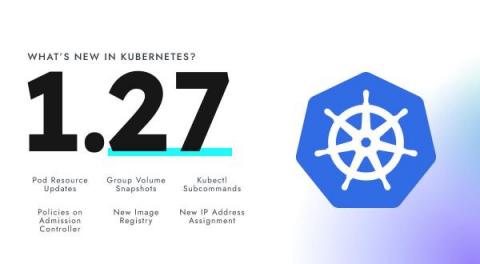
Kubernetes 1.27 - What's new?

This release brings 60 enhancements, way up from the 37 enhancements in Kubernetes 1.26 and the 40 in Kubernetes 1.25. Of those 60 enhancements, 12 are graduating to Stable, 29 are existing features that keep improving, 18 are completely new, and one is a deprecated feature. Watch out for all the deprecations and removals in this version! The main highlight of this release is actually outside Kubernetes.

Troubleshooting Application Issues with Extended Labels

Troubleshooting issues in Kubernetes can be tough. When diagnosing these problems, you can find yourself with tons of microservices to review. Sometimes you come across the root cause straight away, but when dealing with complex issues you may lose a lot of time going back and forth, and time is a precious asset when everything goes up in flames. Sysdig Agent leverages eBPF for granular telemetry.

Kubernetes CreateContainerConfigError and CreateContainerError

CreateContainerConfigError and CreateContainerError are two of the most prevalent Kubernetes errors found in cloud-native applications. CreateContainerConfigError is an error happening when the configuration specified for a container in a Pod is not correct or is missing a vital part. CreateContainerError is a problem happening at a later stage in the container creation flow. Kubernetes displays this error when it attempts to create the container in the Pod.

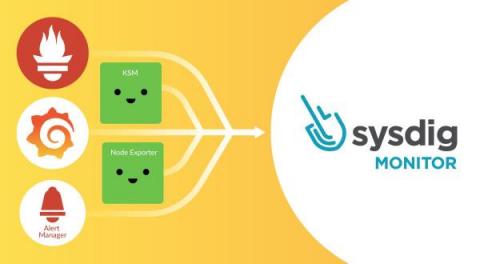
Migrating from Prometheus, Grafana, and Alert Manager to Sysdig Monitor

Are you an OSS Prometheus, Grafana, and Alert Manager user thinking about migrating to Sysdig Monitor, and don’t know about the transition details? Are you wondering what the benefits are of using Sysdig Monitor instead of DIY Prometheus, Grafana, and Alert Manager? If so, then this article is for you!