Operations | Monitoring | ITSM | DevOps | Cloud

Tackling Financial Crime is a Matter of Data: Fresh Thinking on an Age-Old Problem

Financial firms need to take a holistic view on their financial crime defenses to keep pace with the changing crime landscape. Dealing with the onslaught of attacks has historically elicited a Pavlovian response to this age-old problem — increased regulations or tighter risk management protocols, which in turn have proven to be ineffective over the long term.

Derek Saves the Day with Network Monitoring

Network Monitoring solutions, much like the diagnostic and surgical tools of a medical professional, make it easier for the IT team to discover and locate devices installed within the network or operated via the cloud. These systems make it easier for the IT operations team to understand the ongoing issues in real-time, as and when they occur. Whether it is uptime, disk space, or any other performance issues.

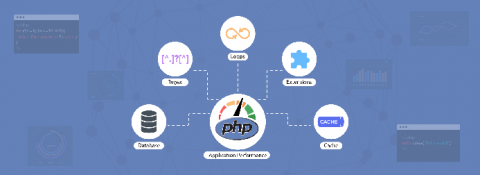
A developer's guide to optimizing PHP performance

With its open-source nature, PHP has evolved into one of the most popular languages among web developers. According to w3techs, 78 percent of websites across the globe use PHP as their server-side language. Even amongst the top 1,000 ranked sites, PHP is dominant, being used by more than 50 percent of them.

Prometheus vs Nagios

Production environment stability and high availability are the holy grail of every SaaS company. R&D organizations put a lot of effort into achieving these goals by implementing different monitoring and alert methodologies and by utilizing a variety of systems and tools. Mean-time-to-detect (MTTD) and mean-time-to-repair (MTTR) are two crucial KPIs that help R&D management personnel determine the efficiency and proficiency of their teams’ responses to production incidents.

Managing Docker Logs with ELK and Fluentd

This article provides an overview of managing and analyzing Docker logs and explores some of the complexities that may arise when looking through the log data. We will go through the default logging approach, as well as look at some more advanced configurations that will make diagnosing issues in your Docker-hosted applications much easier going forward.

Kibana Settings: Spaces, Export Dashboard, and more

Kibana is considered the “window” to Elasticsearch and indeed it’s a powerful UI for searching, filtering, analyzing, and visualizing Elasticsearch data, but Kibana settings are also used to configure, administer and monitor the Elasticsearch cluster. In this lesson, we’re going to explore how Kibana settings can be tweaked for collaborative teamwork. Without further ado let’s jump right into spaces!

Using Dynamic Thresholds for More Proactive Issue Detection

Have you ever been paged for a critical issue and started troubleshooting only to find an obvious drop in requests that weren’t caught by a static threshold? Or a significant increase in a metric that didn’t cross a static threshold? Or even, evidence of warning alerts triggered long ago that should have enabled someone to resolve the issue and prevent it from causing business impact, but instead was ignored in the massive alert volume received by the team?

Best Practices in Handling the Application Insights Custom Events

Application Insights is used to monitor your live applications. It automatically detects performance anomalies. It also helps you to diagnose issues with the help of powerful analytics tools and to understand what users do with your app. The aim of development team is to help you understand how your app is performing and how it is being used by the customers.

Ensuring reliability when modernizing financial applications

For decades, information technology in the financial services industry meant deploying bulky applications onto monolithic systems like mainframes. These systems have a proven track record of reliability, but don’t offer the flexibility and scalability of more modern architectures such as microservices and cloud computing. During periods of unexpectedly high demand, this inflexibility can cause technical issues for organizations ranging from personal trading platforms to major banks.

10 features to consider when choosing your MSP support tool

Managed Service Providers (MSPs) in IT have the unenviable task of hastening the digital transformation in companies, especially during these trying times. It becomes even more onerous, considering that the hardest-hit segment of Small and Medium Businesses (SMBs) are their major customers. According to the Global State of the MSP report, cloud migrations and security are expected to be the top drivers of MSPs growth for MSPs in 2020.