This talk outlines the components of our monitoring stack (what we're allowed to share) and what drove us to seek out Grafana in the first place. We discuss our starting point, the challenges we face on a daily basis, and what we plan for the future as we continue to scale.
Amgen has been on a journey to confront the multi-million dollar elephant in the room. Technical debt that had been passed down for 10 years in their monitoring portfolio. But how to overcome inertia and a failure to understand how to maximize internal value for data that belongs to organization to begin with?
This presentation will give an overview of the growing success of Grafana at CERN with some examples of monitoring solutions and technologies used for the different applications at CERN.
Monitoring Kubernetes is vital to understanding the health and performance of a cluster, but which metrics are most important to add to your dashboards and alert on? Jacob will discuss how to most effectively monitor and visualize your Kubernetes cluster using the Grafana Kubernetes plugin and PromQL.
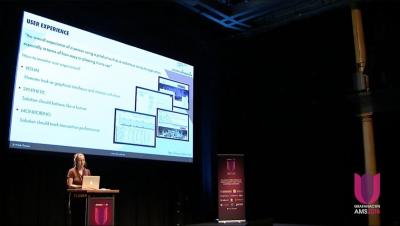
When performance metrics are combined with active user experience and machine learning, we can gain new insights about why a business critical application is slow, what components are involved, and how this impacts users and hardware.
GrafanaCloud makes it easy to set up, operate, and scale a complete Grafana stack in the cloud. We'll discuss the components of GrafanaCloud, how it scales, and how to achieve true interoperability leveraging open source software and avoid SaaS lock-in.
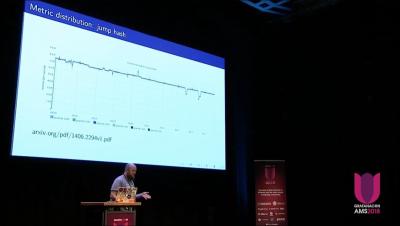
This is a story about dealing with metrics at scale. A lot of metrics. This is our story of the challenges we’ve faced at Booking.com and how we made our Graphite system handle millions of metrics per second.