Operations | Monitoring | ITSM | DevOps | Cloud

Getting started with runtime fields, Elastic's implementation of schema on read

Historically, Elasticsearch has relied on a schema on write approach to make searching data fast. We are now adding schema on read capabilities to Elasticsearch so that users have the flexibility to alter a document's schema after ingest and also generate fields that exist only as part of the search query. Together, schema on read and schema on write provides users with the choice to balance performance and flexibility based on their needs.

Runtime fields: Schema on read for Elastic

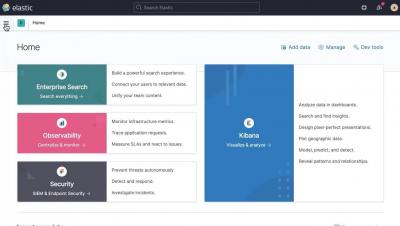
In 7.11, we’re excited to announce support for schema on read in the Elastic Stack. We now offer the best of both worlds on a single platform — the performance and scale of the existing schema on write mechanism that our users love and depend on, coupled with a new level of flexibility for defining and executing queries with schema on read. We call our implementation of schema on read runtime fields.

15 of the Best Data Analytics Tools of 2021

The importance of effective data analytics within an organization is widely accepted by business leaders at this point. With use cases for data analysis spanning every department—from IT management, financial planning, marketing analytics, and so on—the right data analytics tools can have a significant impact on a company’s profitability and growth.

4 Essential Failure Analysis Reports for Monitoring Website Performance & Uptime

In the 1995 movie Apollo 13, one man with a buzz cut told another man with a buzz cut (who then told several other men with buzz cuts) that “failure is not an option.” And thankfully for that extraordinarily dramatic event, it was true. It would be nice if the same commandment held for websites. However, even an infinity of buzz cuts cannot change the fact that, alas, sometimes websites fail.

How to Monitor Your Monitoring Solution with InfluxDB

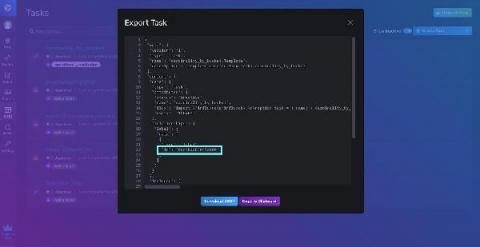
In the real world, if your observability pipeline goes down, you may not receive vital alerts for the system that’s being monitored. To solve that problem, I looked to Sensu Go internally, and decided to utilize the /metrics API endpoint that advertises Prometheus metrics. This is how I conceptualized the Sensu Go Monitoring Template, an InfluxDB Template, by simply posing the question: “How do you monitor your monitoring solution?”

French Ministry of Armed Forces picks Elastic Cloud to fight COVID-19 and future pandemics

WaKED-CO (Watch of Knowledge on Emergent Diseases COVID-19) is an initiative launched in record time — deployed just a month after developing a prototype — under the leadership of the health service within the Ministry of Armed Forces in France. The project had one core mission: to make it easier to research the literature around the COVID-19 crisis.

AI in telecom: an overview for data scientists

I have seen many junior data scientists and machine learning engineers start a new job or a consulting engagement for a telecom company coming from different industries and thinking that it’s yet another project like many others. What they usually don’t know is that “It’s a trap!”. I spent several years forging telecom data into valuable insights, and looking back, there are a couple of things I would have loved to know at the beginning of my journey.

How Operators Build Operational Excellence with Modern Data Platforms Splunk

Enhancing the customer experience and boosting revenue with the power of analytics are key concepts for telecom operators in today’s ultra-competitive business environment. Many telecoms are going through transformation of their system architectures and stacks to change how they operate and manage their day to day operations as well as their strategies and planning for what comes next.