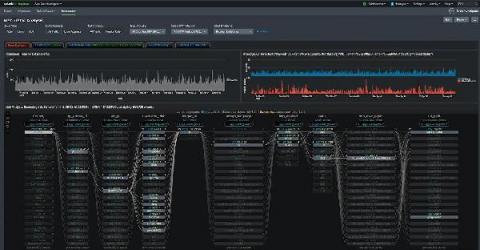
The Splunk Deep Learning Toolkit (DLTK) is a very powerful tool that allows you to offload compute resources to external container environments. Additionally, you can use GPU or SPARK environments. In last Splunk blog post, The Power of Deep Learning Analytics and GPU Acceleration, you can learn more about building a GPU-based environment. Splunk DLTK supports Docker as well as Kubernetes and OpenShift as container environments.
One of our most exciting new projects at Splunk is coming to life. Over the past year, we have been hard at work putting together our vision: a place where Splunk admins, NOC/SOC teams, data analysts, and data scientists can collaborate, experiment, and operationalize their work, all in a single environment inside the Splunk ecosystem. We call it Splunk Machine Learning Environment (SMLE).
With Elastic App Search, you can add scalable, relevant search experiences to all your apps and websites. It offers a host of search result personalization options out of the box, such as weights and boosts and curations. You could also add a these documents might interest you feature, which would surface additional content for users, similar to documents they’ve previously searched for. This post walks you through the process of creating this capability using the robust App Search APIs.
While the Docker buzz has faded a bit, replaced by new words like “Kubernetes” and “Serverless”, there is no arguing that Docker is the default toolchain for developers looking to get started with Linux containers, as it is fairly ubiquitous and tightly integrated with a variety of platforms.
Want to create a map of where your users are? With the GeoIP processor, you can easily attach the location of your users to your user metrics. Right out of the box, Kibana can map this traffic immediately by country or country subdivision: Plus, the new User Experience app for Elastic APM automatically creates maps based on monitoring data: But what if you want to take this one step further and create maps with different regions?
Data visualization is a simple presentation of data or information in a graphical format. Humans are naturally drawn to colors and patterns and these tools make it easier for people to interpret and understand data. Numbers are complex and they can be difficult to understand conceptually. Whereas, data visualization or pictorial representation can spark an interest in your audience to listen and learn more from your presentation.
We recently announced a license change: Blog, FAQ. We posted some additional guidance on the license change this morning. I wanted to share why we had to make this change. This was an incredibly hard decision, especially with my background and history around Open Source. I take our responsibility very seriously. And to be clear, this change most likely has zero effect on you, our users. It has no effect on our customers that engage with us either in cloud or on premises.
Did you know that you can easily upgrade to the next version with the Update Manager? Contact us to try Pandora FMS Enterprise and know all its advantages: https://bit.ly/2O9hoRf