Operations | Monitoring | ITSM | DevOps | Cloud

September 2024

How to build automatic remediation workflows in Grafana Cloud

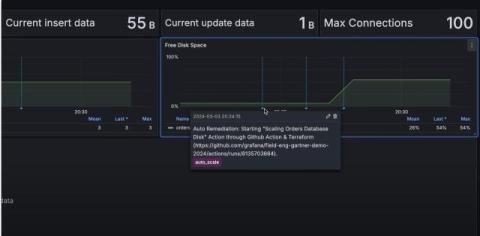
When incidents occur, engineers must jump into action to get systems back to running at peak performance. However, there are a myriad of challenges that can prevent them from resolving the issues swiftly. Imagine a scenario where a team of DevOps engineers manages a cloud-based e-commerce platform that experiences occasional spikes in traffic during peak shopping seasons. During one of those major sales events, the team notices a sharp spike in CPU usage across several critical application servers.

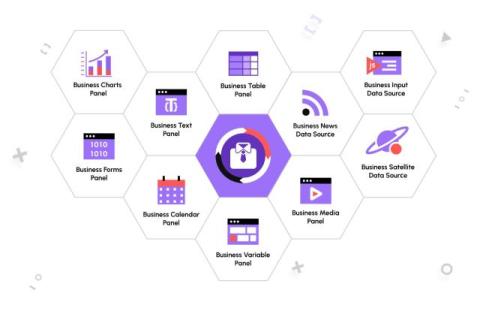
Convert your dashboards into comprehensive web applications with the Business Suite for Grafana

Daria Volkova is a Grafana champion and Volkov Labs co-founder. The Business Suite for Grafana is a collection of uniquely positioned plugins developed by Volkov Labs. Each offers flexible and adaptable solutions for a wide range of business needs that go beyond observability, including file uploads, building a chart of any kind and configuration, leveraging all aspects of web design, video streaming, and more. This blog post provides details, examples, and short tutorials.

Grafana Cloud updates: The Explore apps suite for queryless data analysis, Adaptive Logs for cost optimization, and more

We consistently roll out helpful updates and fun features in Grafana Cloud, our fully managed observability platform powered by the open source Grafana LGTM Stack (Loki for logs, Grafana for visualization, Tempo for traces, and Mimir for metrics). And this month, on the heels of ObservabilityCON 2024 — our flagship observability event — we have no shortage of updates to share.

Contextual root cause analysis in Grafana Cloud

In this video, you will learn how to troubleshoot your application faster with Grafana Cloud Asserts, which provides contextual root cause analysis in Grafana Cloud. You'll learn how SLO alerts, the RCA (root cause analysis) Workbench, and prebuilt Grafana dashboards for Grafana Cloud solutions seamlessly work together to help you quickly investigate an issue.

Explore Logs app now generally available | Grafana

In this video, Mat Ryer, Senior Principal Engineer at Grafana Labs, demonstrates how you can use the Explore Logs app to quickly gain insights from your data using a simple, point-and-click interface. Mat also discusses how you can use Explore Logs to drill down into your logs to investigate issues further, and how to use patterns to get rid of noise.

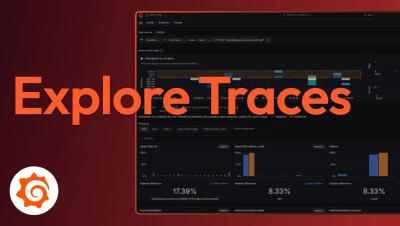
Explore Traces app now in public preview | Grafana

In this video, Mat Ryer, Senior Principal Engineer at Grafana Labs, provides an overview of the Explore Traces app for Grafana, which lets you automatically surface insights from your traces with an intuitive, point-and-click interface. Mat demonstrates how you can use the Comparison view to quickly identify the source of errors, and how to drill down to see a full trace in detail to gain a more comprehensive understanding of your system.

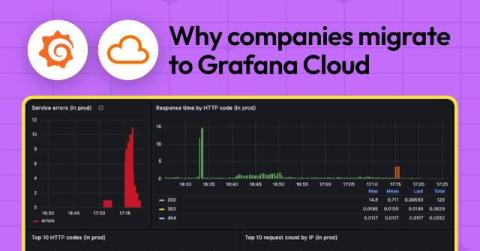
Lower observability bills, reduced MTTR, and more: why companies migrate to Grafana Cloud

There are a lot of factors that go into choosing an observability solution. And even after all that careful consideration, sometimes the platform you initially invest in doesn’t meet your needs, especially as your organization grows and evolves. For that very reason, we’ve seen users begin their observability journeys with another tool, and then decide to migrate to Grafana Cloud, our fully managed cloud-hosted observability platform.

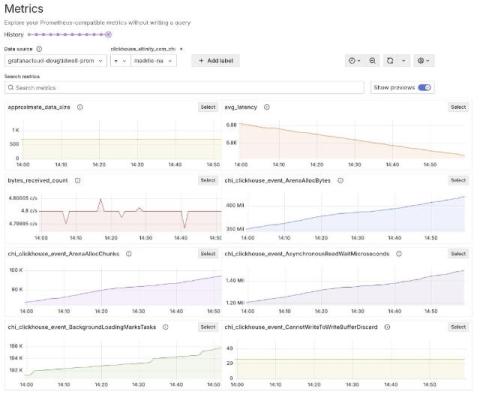
How to monitor metrics and logs from Altinity.Cloud in Grafana Cloud

Doug Tidwell is the Director of Content at Altinity, responsible for creating useful content for ClickHouse users in general and Altinity customers in particular. He has more than 30 years of experience in databases, CI/CD systems, development tools, and middleware. When it comes to visualizing, monitoring, and logging ClickHouse clusters, there’s no easier way to accomplish all three than with Grafana Cloud, the open and composable observability stack powered by open source.

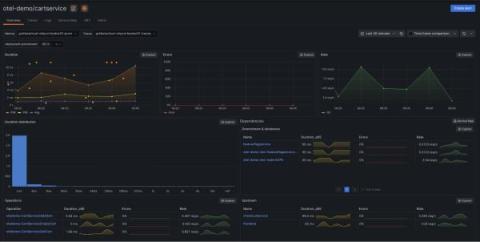
Grafana OpenTelemetry distributions: prioritizing simplicity, sticking to OSS values

The OpenTelemetry (OTel) project offers numerous components and instrumentations that support different languages and telemetry signals. However, this flexibility can be overwhelming, and new users often struggle to choose the right components and configure them properly for their specific use cases. To address this, OpenTelemetry defines the concept of a distribution, a tailored and customized version of OpenTelemetry components.

Bloom filter changes for Grafana Loki (Loki Community Call Sep 2024)

In this Community Call, Senior Software Engineer Christian Haudum talks to us about bloom filter changes for Grafana Loki, including the deprecation of the bloom compactor and a pivot towards creating bloom filters for structured metadata. Bloom filters are a probabilistic data structure that we're using to improve query performance in Loki. Community Calls are monthly meetings that are open to everyone interested in the development of Loki. They are an opportunity for software engineers working on Loki to discuss new features as well as for open-source users of Loki to ask questions.

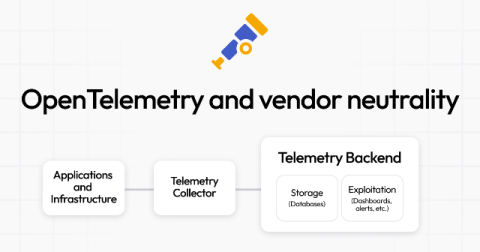
OpenTelemetry and vendor neutrality: how to build an observability strategy with maximum flexibility

One of the biggest advantages of the OpenTelemetry project is its vendor neutrality — something that many community members appreciate, especially if they’ve spent huge amounts of time migrating from one commercial vendor to another. Vendor neutrality also happens to be a core element of our big tent philosophy here at Grafana Labs. We realize, however, that this neutrality can have its limits when it comes to real-world use cases.

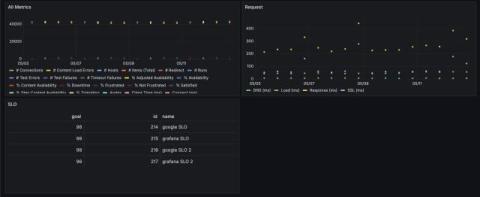
The Catchpoint Enterprise data source for Grafana: key features and how to get started

Earlier this year, we were thrilled to announce that Catchpoint is now available as an Enterprise data source for Grafana! With the public preview release of the Catchpoint Enterprise data source, you can seamlessly bring Catchpoint’s extensive Digital Experience Monitoring (DEM) and Internet Performance Monitoring (IPM) capabilities into your Grafana dashboards, enhancing your ability to visualize and analyze performance metrics in real-time.

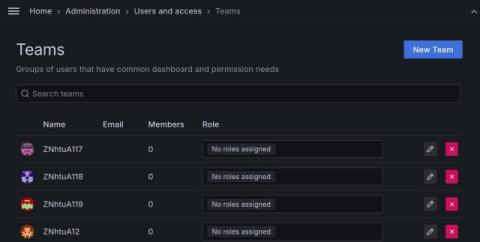
Grafana access management: How to use teams for seamless user and permission management

If you’re looking to simplify user access and permissions in your Grafana instance, then this blog post is for you.That’s because we’re going to walk through how to set up a streamlined system for managing user permissions with Grafana teams. We’ll focus on Entra ID (formerly Azure Active Directory) as our user repository and identity provider, but these steps can be adapted to other identity providers as well, including Okta and Keycloak.

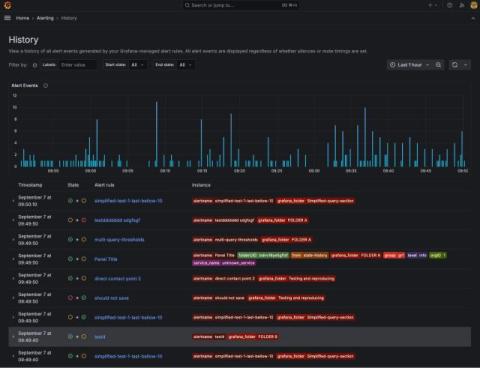
Better root cause analysis: Mastering alert insights with the new central history timeline

A year ago we rebuilt our alert rule state history, using Grafana Loki for storage and updating the UI to display a timeline of all state changes of an alert rule. As a result, users can now conduct better root cause analysis by going down to the level of an alert rule and seeing when certain alert instances started or stopped firing. But we aren’t stopping there. To ensure system stability and avert outages, you also need one place to see the state history for all the alerts in your system.

Grafana Tempo 2.6 release: performance improvements and new TraceQL features

Grafana Tempo 2.6 is here with performance improvements and buckets of new TraceQL features! Watch the video above for an overview of the new TraceQL features, or continue reading to get a quick overview of the latest updates in Tempo. If you’re looking for something more in-depth, don’t hesitate to jump into the Grafana Tempo 2.6 release notes or the changelog.

How to Automatically Remediate Incidents with Grafana IRM

Build automatic remediation workflows to preemptively resolve system issues and minimize downtime. With observability-native IRM, you can automate routine tasks, ensure consistent responses, and reduce the manual effort required to manage incidents. Grafana Cloud is the easiest way to get started with Grafana dashboards, metrics, logs, and traces. Our forever-free tier includes access to 10k metrics, 50GB logs, 50GB traces and more.

Visualize Catchpoint, PagerDuty, and Amazon DynamoDB data: what's new in Grafana Enterprise data source plugins

As part of our big tent philosophy here at Grafana Labs, we believe you should be able to access and derive meaningful insights from your data, regardless of where that data lives. One of the ways we stay true to that philosophy is through our Grafana Enterprise data sources.