Operations | Monitoring | ITSM | DevOps | Cloud

December 2020

Loki 2020 year in review

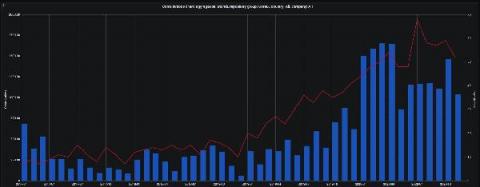
What a year 2020 has been for Grafana Loki! Just a little more than a year ago, we announced Loki’s 1.0.0 GA release. We’re excited to report that 2020 brought a big uptick in its adoption (users have quickly realized the advantages of a small index—plus, Loki has non-technical advantages, too); significant performance enhancements; and the recent release of Loki 2.0.

Why we helped AWS build its Prometheus service

During a re:Invent keynote on Dec. 15, Amazon announced its AWS Managed Service for Prometheus. The service is built using the CNCF’s Cortex project, the open source, horizontally scalable Prometheus-compatible project that I started with Julius Volz over four years ago. I’d like to take this opportunity to extend a warm welcome to the Prometheus-as-a-Service club! We think you’ve made a good choice choosing Cortex, and see this as a massive vote of confidence in the project.

Why Grafana Labs delivers the best Prometheus in the Cloud

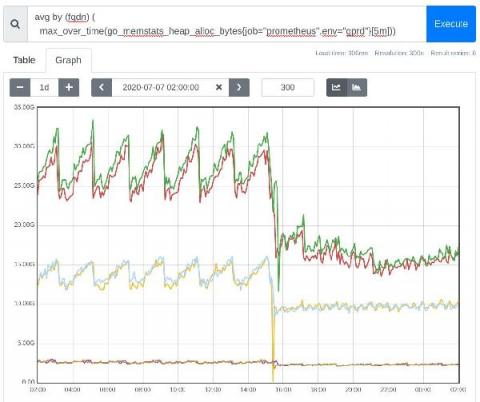
Over the last several months, there have been a variety of service providers that have launched Managed Prometheus offerings. This is a testament to the rise in popularity of the Prometheus project, and how it’s becoming a de facto standard for metrics. The most recent announcement in the Managed Prometheus landscape came from AWS. During a re:Invent keynote on Dec. 15, Amazon announced its AWS Managed Service for Prometheus.

With the new AWS IoT SiteWise plugin, you can visualize and monitor your equipment data in Grafana dashboards

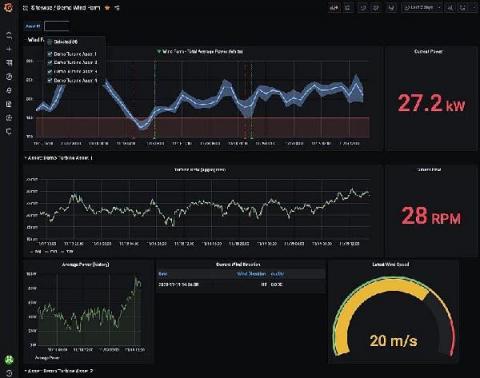
In collaboration with the AWS team, we have just launched another AWS integration, the AWS IoT SiteWise plugin for Grafana. AWS IoT SiteWise is a managed service that helps users collect, store, organize, and monitor data from industrial equipment, across facilities, at scale.

Our new partnership with AWS gives Grafana users more options

At AWS re:Invent today, Dr. Werner Vogels, VP and CTO of Amazon.com, announced a partnership between AWS and Grafana Labs, resulting in the Amazon Managed Service for Grafana, a scalable managed offering that provides AWS customers a native way to run Grafana directly within AWS alongside all their other AWS services. We’d like to give a big thanks to the whole Grafana community. Not only have they inspired us with so many great use cases, but they help us build better software every day.

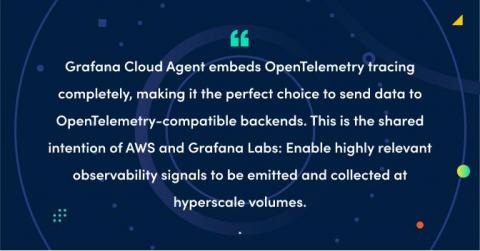
AWS and Grafana Labs are working together on cloud native observability

Cloud native observability is at a watershed moment. The explosion of microservices has created previously unseen amounts of monitoring data, limiting the ability of humans and computer systems to extract meaning from data with last-generation tools. Debugging is often a process of detecting correlation, and then turning correlations into causal connections. This is where modern cloud native tooling comes in.

Effective troubleshooting with Grafana Loki - query basics

Loki doesn't index your logs, and that is a very different approach than popular full-text search engines like Elasticsearch or Solr That sounds like a huge constraint. How can you do powerful searches if you don't index the log lines? After this video, you now know how to use Loki's "filter" capability for forensic troubleshooting. Happy searching!

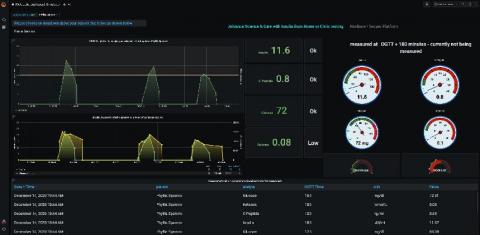
How Grafana is helping the DIFFERENCE Foundation visualize medical data in their fight against a global pandemic

The DIFFERENCE Foundation is a non-profit organization based in the Netherlands that is focused on designing, guiding, and funding highly quantitative research on metabolic dysfunction. The foundation considers metabolic dysfunction—which can trigger obesity, diabetes, many other diseases—the original global pandemic, as it affects almost one quarter of the global population.

The 7 cultural values that drive Grafana Labs

At Grafana Labs, we believe that our culture is one of the differentiators that make us an extraordinary company. In the middle of a pandemic, we’ve been in the very fortunate position to be in a high-growth phase: We’ve expanded the team by 118% this year, and our headcount just tipped over 250 global Grafanistas.

How to create fast queries with Loki's LogQL to filter terabytes of logs in seconds

LogQL, the Loki query language, is heavily inspired by Prometheus PromQL. However, when it comes to filtering logs and finding the needle in the haystack, the query language is very specific to Loki. In this article we’ll give you all the tips to create fast filter queries that can filter terabytes of data in seconds. In Loki there are three types of filters that you can use.

How to find traces in Tempo with Elasticsearch and Grafana

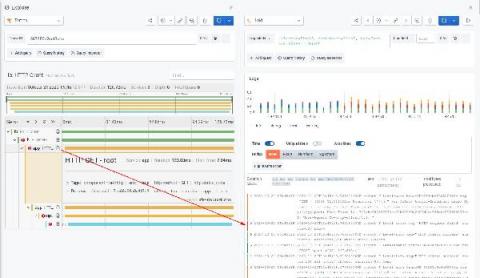
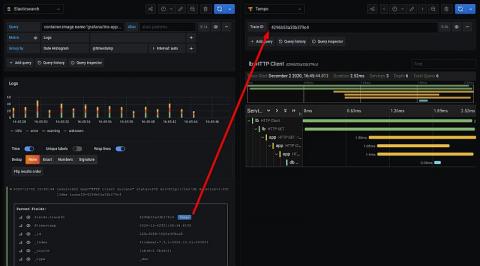
Grafana Tempo, the recently announced distributed tracing backend, relies on integrations with other data sources for trace discovery. Tempo’s job is to store massive amounts of traces, place them in object storage, and retrieve them by ID. Logs and other data sources allow users to quickly and more powerfully jump directly to traces than ever before. Previously we investigated discovering traces with Loki and exemplars.

What does the future hold for Site Reliability Engineering?

Site Reliability Engineering, or SRE for short, has become quite the buzzword. I wasn’t there in 2004, when Ben Treynor started it at Google, but I claim bragging rights based on the fact that the very same Ben Treynor interviewed me for an SRE role in 2005. (I also got the job after the interview, in case that wasn’t obvious…) When SREcon EMEA 2019 came along, I thought it was just about time to publicly speculate about the future of our profession.