Operations | Monitoring | ITSM | DevOps | Cloud
June 2020
Monitoring Java applications with the Prometheus JMX exporter and Grafana
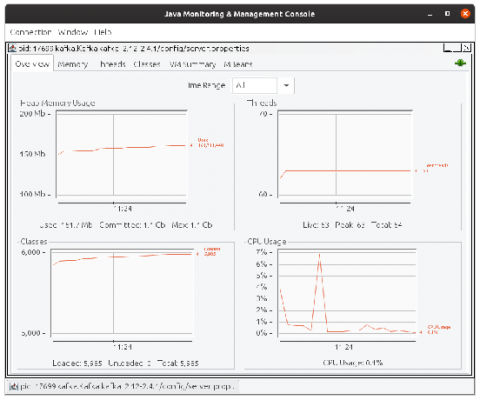
We all know that Prometheus is a popular system for collecting and querying metrics, especially in the cloud native world of Kubernetes and ephemeral instances. But people forget that Java has been running enterprise software since 1995, while Prometheus is a relative newcomer to the scene. It was only created in 2012! Even though Java has had its own metric collectors since before Prometheus was born, none of our new environments speak its (metric) language. How can you bridge that gap?
Learn Grafana: How to build a scatter plot plugin in Grafana 7.0
There are a lot of great things about Grafana 7.0, but one of my favorite features is the new React-based plugin platform, which has a set of new APIs and design system to help you build your own plugin. The process is easier and faster than ever. In this blog post, I’ll show how you can create a panel plugin for visualizing scatter plots. A scatter plot is a type of graph that displays values for (usually) two variables as a set of points along a horizontal and vertical axis.
How to visualize Prometheus histograms in Grafana
Do you have a Prometheus histogram and have you asked yourself how to visualize that histogram in Grafana? You’re not alone. Here, we will show you how it’s done. This post assumes you already have a basic understanding of Prometheus and Grafana and it will look at Prometheus histograms from the perspective of Grafana 7.0.
Migrating Grafana's template variables from AngularJS to React: A tale of failures and wins
As many of you already know, we created Grafana using AngularJS, but we have been migrating to React for about two years now. One of the big missing pieces in our migration puzzle was the templating system. This post starts in late 2019 when I first got my hands on this mysterious and complex area of the Grafana code base.
How Grafana Labs enables horizontally scalable tail sampling in the OpenTelemetry Collector
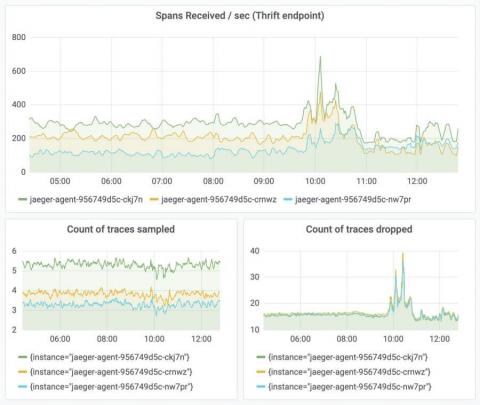
Tracing is a widely adopted solution to provide performance insights into distributed applications. It is a valuable resource for developers to view the service call graph and track service latency at a granular level. It’s also a handy tool for on-call engineers to drill down and debug a problematic service during an outage. There are a number of open source distributed tracing frameworks out in the wild, including Jaeger, Zipkin, and OpenTelemetry.
Plugin showcase: The hourly heatmap panel, built on Grafana's new plugin platform
Since Petr Slavotinek created the Carpet plot plugin in 2017, it’s been one of the most popular community plugins for Grafana. Unfortunately, even though the Carpet plot plugin continues to be useful to many users, it’s no longer being maintained. Grafana 7.0 introduced a brand new React-based platform, along with a set of improved APIs for building plugins.
How we made working with Prometheus easier with metric metadata in Grafana's Explore view
At Grafana Labs, we’re all big fans of the Prometheus and Grafana combination. To an extent, we just won’t shut up about it. We strongly believe in simplicity and think you shouldn’t need any extra effort to understand the metrics of your service(s) holistically. Yet we’ve all been in that situation where it is challenging to fully grasp what the metrics of our service(s) are and what they do. While naming conventions exist, at times they are not followed or enforced.
New in Grafana 7.0: Data transformations for all visualizations that support queries
Among the many new features introduced in Grafana 7.0, one of the most exciting ones is transformations. The concept of data transformation is not new to Grafana, but prior to Grafana 7, it was fairly rigid and available only in the Table panel.
New in Prometheus v2.19.0: Memory-mapping of full chunks of the head block reduces memory usage by as much as 40%
The just-released Prometheus v2.19.0 introduces the new feature of memory-mapping full chunks of the head (in-memory) block from disk, which reduces memory usage and also makes restarts faster. I will be talking about this feature in this blog post.
Learn Grafana: How to automatically repeat rows and panels in dynamic dashboards
Running your software on dynamic infrastructure means that your monitoring platform needs to change dynamically. Variables let you reuse a single dashboard for all your services. Select the service you want to inspect from a drop-down menu, and watch panels update to only show you metrics from that service. Grafana lets you create dynamic dashboards using template variables. Any variables in your queries interpolate the current value of the variable before the query is sent to the database.
How a regex simplification in Loki increased performance by up to 300x
When we graduated Loki into a GA release last year, there were more than 137 contributors who already made more than 1,000 contributions to the project. We also added hosted Loki to the lineup of Grafana Cloud offerings after it proved to be stable internally for our ops cluster, storing 40TB and half a trillion log lines each month. There was, however, one persistent problem that kept surfacing, especially for developers who were writing applications in Go: The regex package was slow.
How Hiya migrated to Grafana Cloud to cut costs and gain control over its metrics
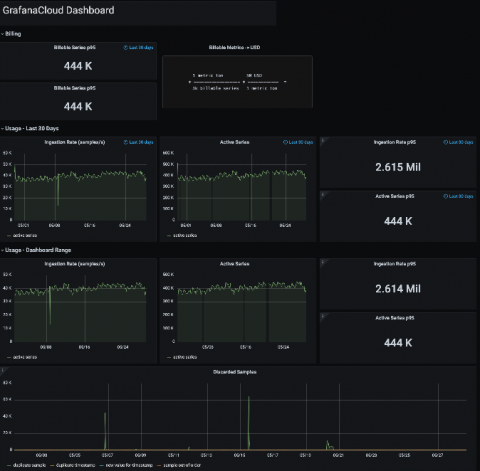
Last year, when a company that works with several of the world’s top carriers, OEMs, and enterprises to provide caller identity and spam blocking services for more than 120 million users needed to make changes to their monitoring service, Grafana Labs got the call. Hiya was founded in 2016, and from the start was a container-centric Kubernetes shop.
Grafana 6.7.4 and 7.0.2 released with important security fix
Today we are releasing Grafana 6.7.4 and 7.0.2. These patch releases include an important security fix for an issue that affects all Grafana versions from 3.0.1 to 7.0.1.
GrafanaCONline recap: Grafana 7.0, Prometheus deep dives, Loki future, electric cars, wine waste, and more
GrafanaCONline wrapped up last Friday, and we were thrilled to have so many of you join the sessions over the past three weeks. Thank you for tuning in, asking questions, chatting on Slack, and generally making our reimagined conference a success.


